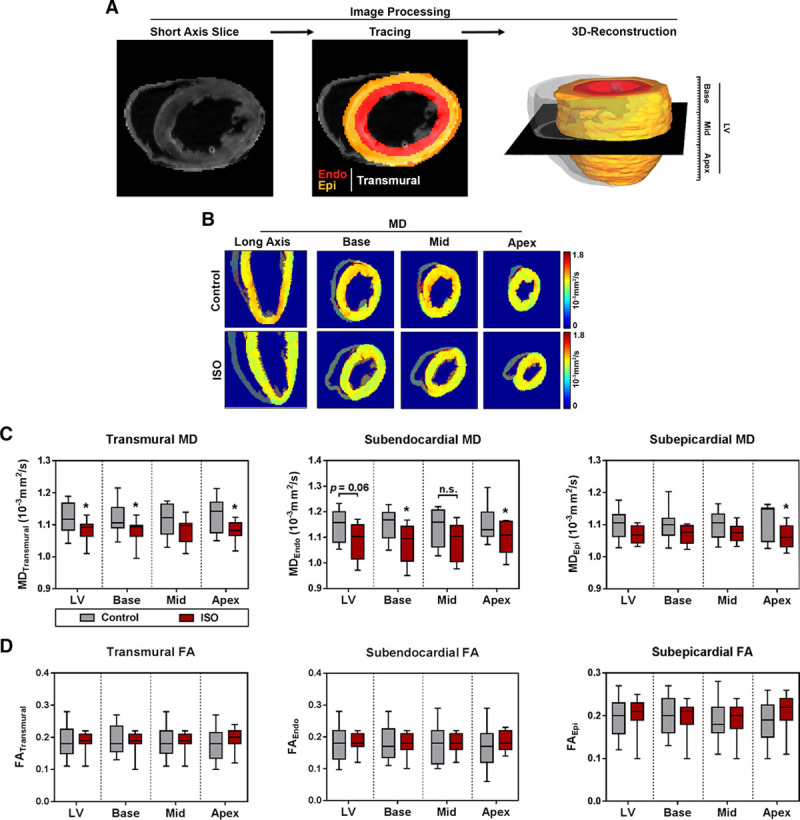
Figure 2.

Diffusion tensor magnetic resonance imaging post-processing and diffusion metrics. A, Endocardial and epicardial borders were traced manually in multiple short axis slices per heart, and subendocardium (Endo) and subepicardium (Epi) were defined as regions of interest. Subsequently, 3-dimensional volumes were rendered by tomographic reconstruction allowing analyses of both regions for the whole left ventricle (LV) or within myocardial segments (base/mid/apex). B, Representative color maps for mean diffusivity (MD) in a reconstructed cardiac long axis and different myocardial short axis segments. C, Analysis of MD. D, Analysis of fractional anisotropy (FA). Medians and quartiles with minimum and maximum values; n=9–11 per group; Student t test. *P<0.05. ISO indicates isoproterenol.
