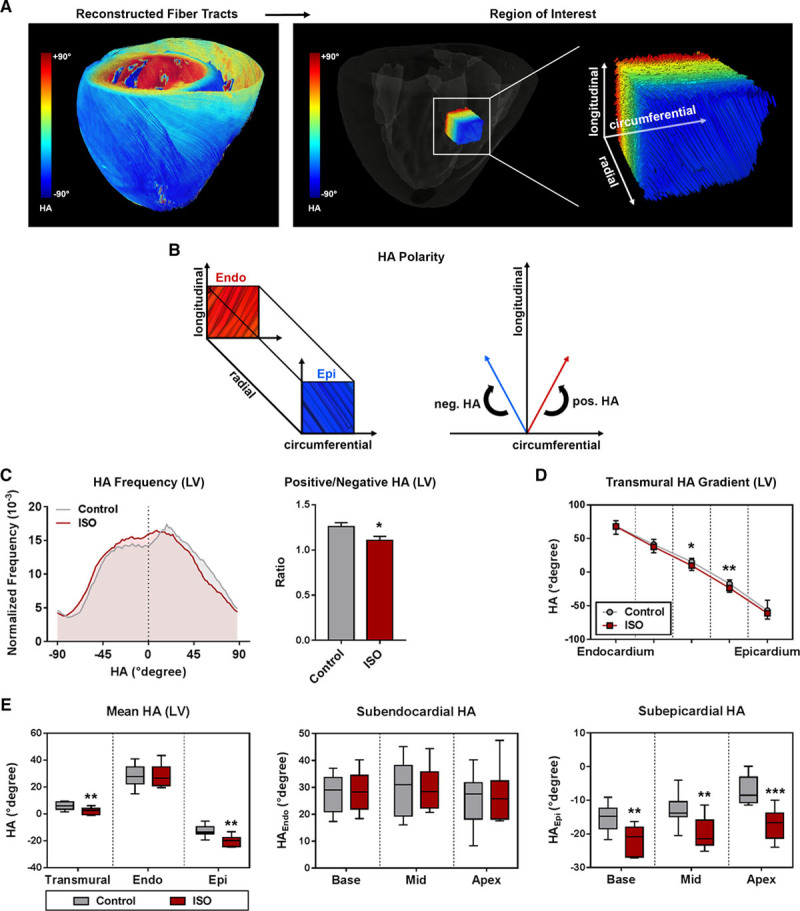
Figure 3.

Myofiber geometry. A, Representative reconstruction of fiber tracts: helix angle (HA) in the left ventricle (LV) changes continuously from positive values in the subendocardium (right-handed helix), over neutral in the mesocardium, to negative values in the subepicardium (left-handed helix). B, Definition of HA-polarity. Mean±SEM (C, D) or medians and quartiles with minimum and maximum values. E, Analysis of HA. Medians and quartiles with minimum and maximum values; n=9–11 per group; Student t test. Endo indicates subendocardium; Epi, subepicardium; and ISO, isoproterenol. *P<0.05 and **P<0.01.
