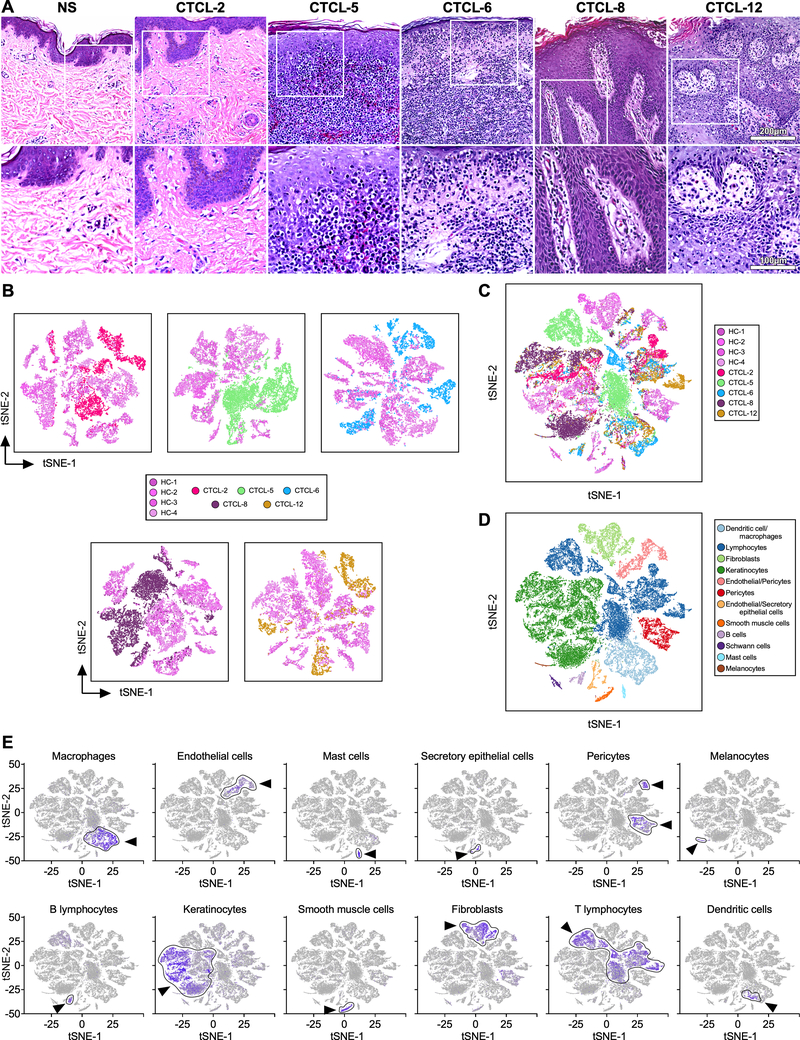
Fig. 1. Grouping of CTCL and normal skin populations.
Transcriptomes of 44,842 cells from four normal (14,179 cells) and five advanced-CTCL (30,663 cells) skin biopsies clustered using Seurat (19). (A) Hematoxylin and eosin staining (H&E) of skin biopsies from representative normal skin (NS) and the five tumors analyzed by scRNA-seq: top row at 200X, bottom at 400X. (B) Two-dimensional t-SNE shows dimensional reduction of reads from single cells, revealing grouping in each CTCL sample compared to all healthy control skin samples. Cells from each subject are indicated by different colors. (C) All samples in (b) are combined. (D) Distinct gene expression signatures are represented by the clustering of known markers for multiple cell types and visualized using t-SNE. Clusters belonging to each cell type are color coded. (E) Cell types in skin cell suspensions were identified by cell-specific marker as previously described (18), including AIF1 - macrophages; VWF - endothelial cells; TPSAB1 - mast cells; SCGB1B2P - secretory (glandular) cells; RGS5 - pericytes; PMEL - melanocytes; MS4A1 - B cells; KRT1 - keratinocytes; DES - smooth muscle cells; COL1A1 – fibroblasts; CD3D - T lymphocytes; and CD1C - dendritic cells. Intensity of purple color indicates the normalized level of gene expression. Cell-type specific clusters are indicated by an arrow and gates are drawn around each cluster. t-SNE, t-distributed stochastic neighbor embedding.

