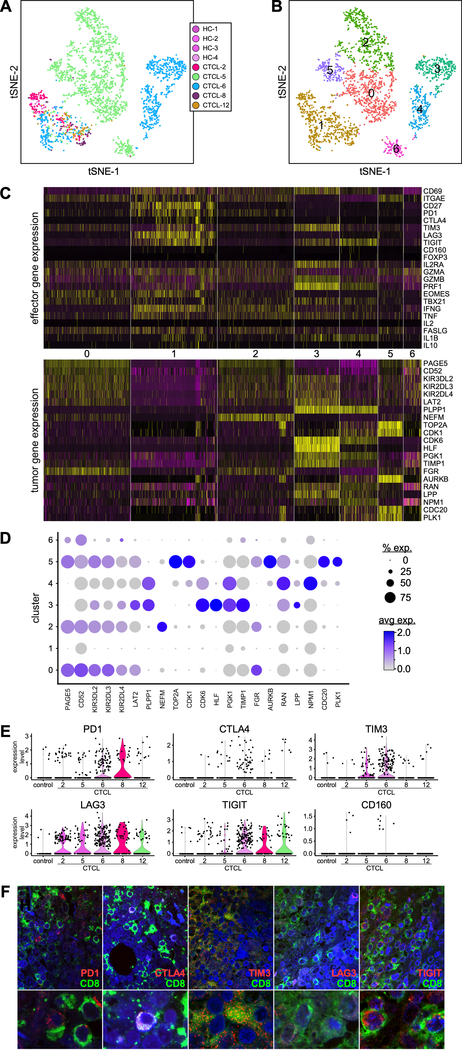
Fig. 5. Expression of effector and exhaustion genes by CD8+ T cells across patient skin tumors.
(A) Transcriptomes of CD8+ T lymphocytes from individual CTCL tumors and normal skin samples (color coded by subject), revealing 7 discrete Louvain clusters (B). (C) Gene expression from the 7 discrete Louvain clusters in (b), showing DE of co-inhibitory receptors and effector molecules (upper panel) and of tumor-associated genes (lower panel). Cluster numbers are indicated in the middle. Each column represents a cell. (D) Dot-plot shows the proportion of cells and the scaled average gene DE expression of the tumor-associated genes selected in (c, lower panel). (E) Violin plots show expression of co-inhibitory receptors by CD8+ T lymphocytes from cluster 1. (F) Immunofluorescence microscopy shows co-expression of CD8 and co-inhibitory receptors, as indicated, in advanced-stage CTCL skin tumors. A representative experiment is shown at 1000X (top) and zoomed-in by 3X (bottom).

