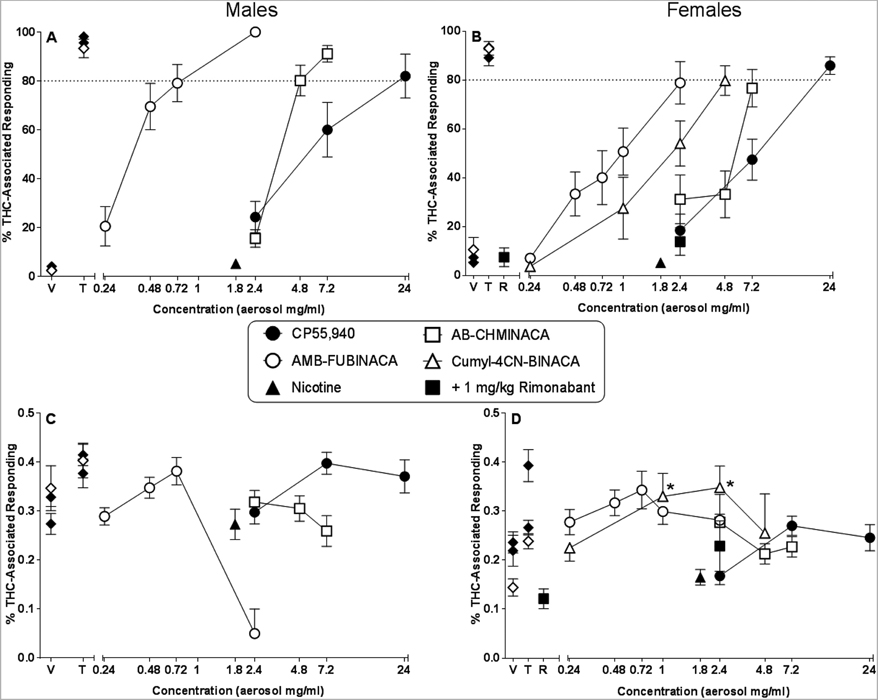
Figure 2.
Effects of aerosolized CP55,940 (filled circles), AB-CHMINACA (unfilled squares), AMB-FUBINACA (unfilled circles), cumyl-4CN-BINACA (unfilled triangles; females only) and 1.8 mg/ml nicotine (filled triangles) on percentage of responses that occurred on the THC-associated aperture in male (panel A) and female (panel B) C57/Bl6J mice trained to discriminate 5.6 mg/kg THC (i.p.) from vehicle. Response rates for male (panel C) and female (panel D) mice for each dose are also shown. Also shown are results of control test with i.p. 1 mg/kg rimonabant alone (R; left side of panels B and D; filled squares) and in combination with 2.4 mg/ml aerosolized AMB-FUBINACA (right side of panels B and D; filled squares). Points (filled diamonds) at the left side of each panel represent results of control tests with vehicle (V) and 5.6 mg/kg THC (T) (filled diamonds = i.p. injection alone; unfilled diamonds = i.p. injection followed by vehicle aerosol exposure). At each concentration, 12–13 male mice (panels A and C) or 12–14 female mice (panels B and D) were evaluated for response rate data and for percentage THC-aperture responding, except n=6 and 7 male and female mice, respectively, for aerosol vehicle; n=3 male mice at the 2.4 mg/ml concentration of AMB-FUBINACA; n=8 female mice for tests with rimonabant (R) alone and in combination with 2.4 mg/ml AMB-FUBINACA; and n=6 female mice at each concentration of cumyl-4CN-BINACA. In addition, data for percentage THC aperture responding only (not for response rate) were excluded from mean calculations for mice that did not respond at least 10 times on either aperture (i.e., did not meet the criteria for choosing an aperture). Hence, for this measure, the mean percentage of THC aperture responding was comprised of data from 5 mice at the 4.8 mg/ml concentration of cumyl-4CN-BINACA, and n=1 and 11 male and female mice, respectively, at the 2.4 mg/ml concentration of AMB-FUBINACA. Each point represents the mean (± SEM) of included data, as specified above. Asterisk (*) indicates significant difference (p<0.05) compared to respective vehicle.

