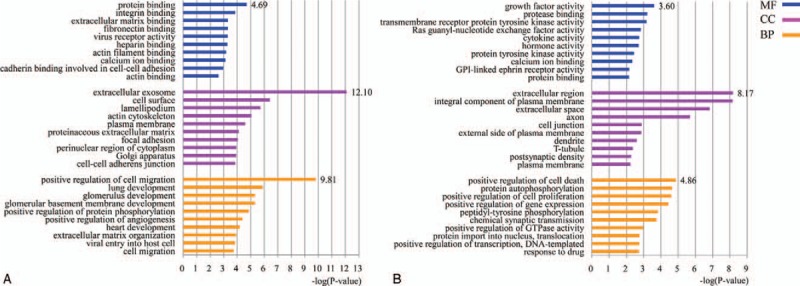
Figure 2.

(A) GO analysis of the downregulated DEGs in DN (top 10). (B) GO analysis of the upregulated DEGs in DN (top 10). BP = biological process, CC = cellular component, DEGs = differentially expressed genes, DN = diabetic nephropathy, GO = gene ontology, MF = molecular function.
