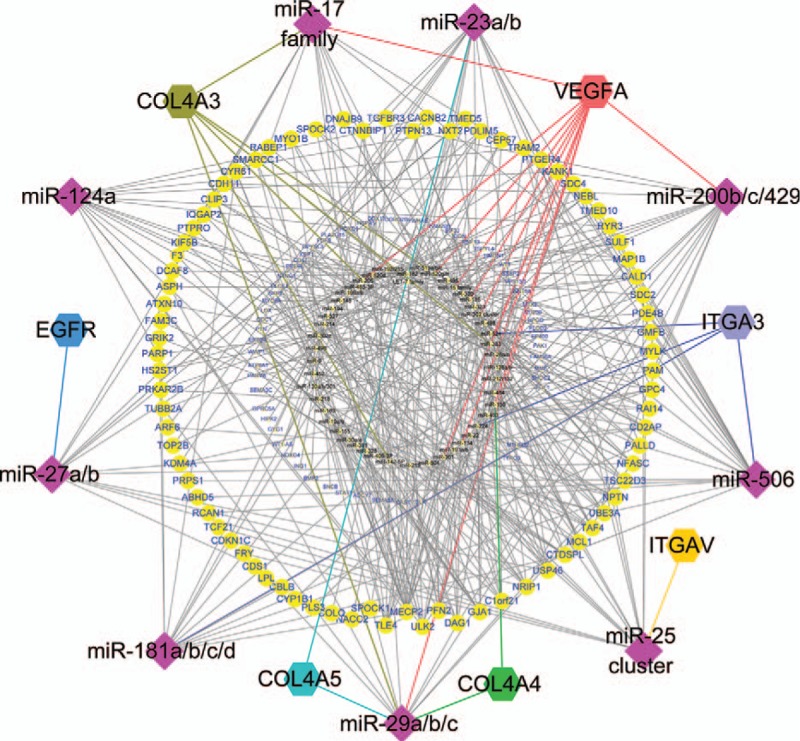
Figure 4.

Global network diagram of the interactions between the key miRNAs and their target genes. The diamond nodes represent the 9 key miRNAs. The hexagonal nodes represent the 5 hub genes (ITGB5 and CCL19 did not correspond to the miRNAs). The large round nodes represent genes associated with the 9 key miRNAs, and the small round nodes represent the other upregulated genes and miRNAs. miRNAs = microRNAs.
