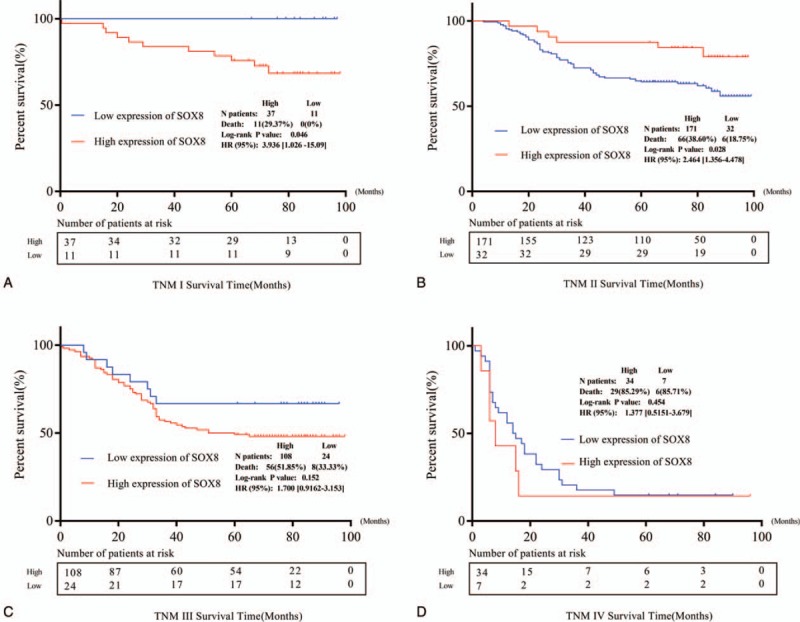
Figure 5.

Kaplan–Meier curves of overall survival stratified according to the status of SOX8 expression. A and B Kaplan–Meier survival curves of overall survival among patients with SOX8 expression compared with patients TNM I stage and TNM II stage. C and D Kaplan–Meier survival curves of overall survival among patients with SOX8 expression compared with patients TNM III stage and TNM IV stage..
