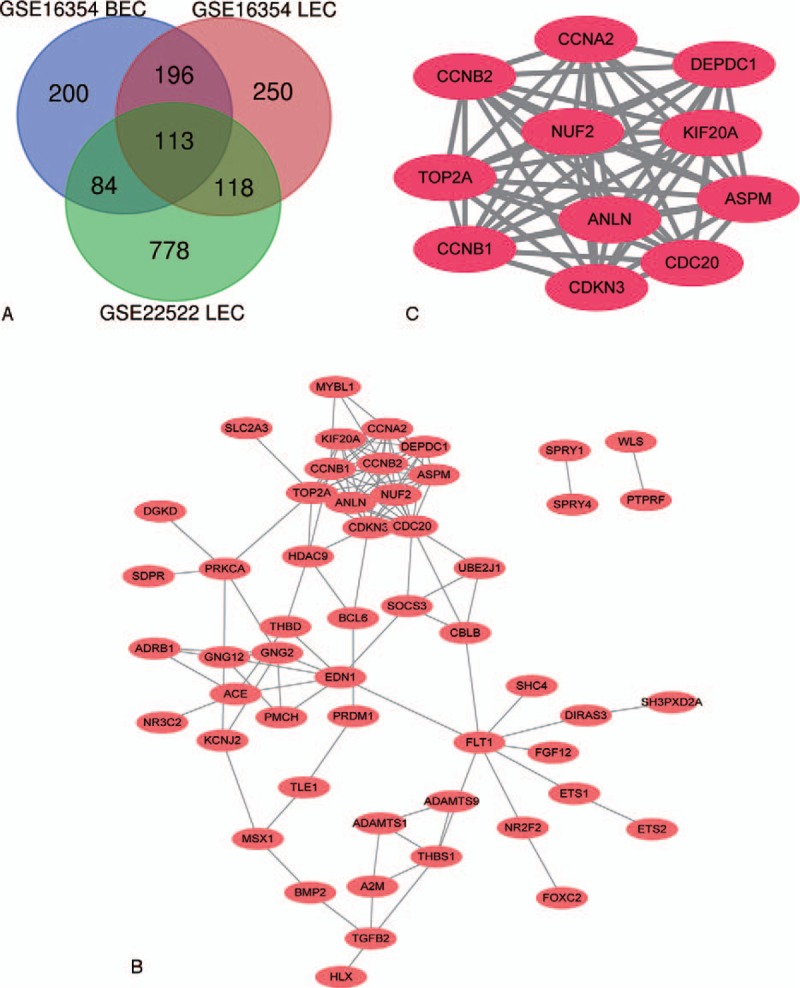
Figure 1.

Venn diagram, PPI network and the most significant module of DEGs. (A) DEGs were selected with |logFC| (fold change) ≥1 and P value <.01 among the mRNA expression profiling sets GSE16354 and GSE22522. The 2 datasets showed an overlap of 113 genes. (B) The PPI network of DEGs was performed using Cytoscape. (C) The most significant module was obtained from PPI network with 11 nodes and 55 edges.
