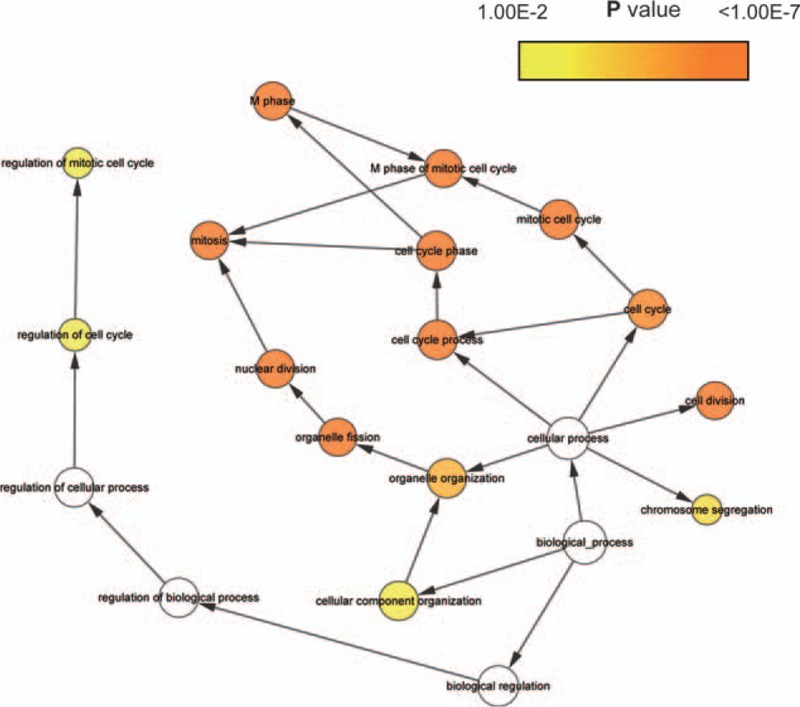
Figure 2.

The biological process analysis of hub genes was conducted using BiNGO. The color depth of nodes refers to the corrected P value of ontologies. The size of nodes refers to the numbers of genes that are involved in the ontologies. P < .01 was considered statistically significant.
