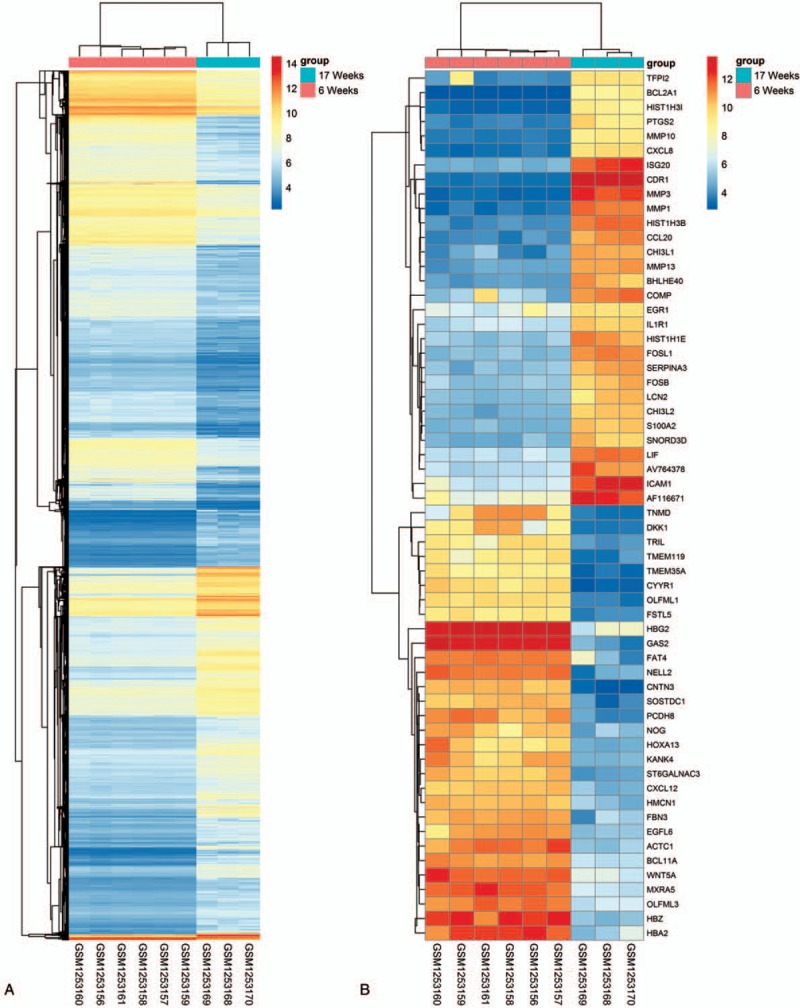
Figure 3.

Heat map showing A. all and B. top 30 up-regulated and down-regulated differentially expressed genes in 17-week RC compared to 6-week PC. The expression values are log2 fold changes (>1 or <−1). Blue represents down-regulation and red represents up-regulation. PC = prechondrocytes, RC = resting chondrocytes.
