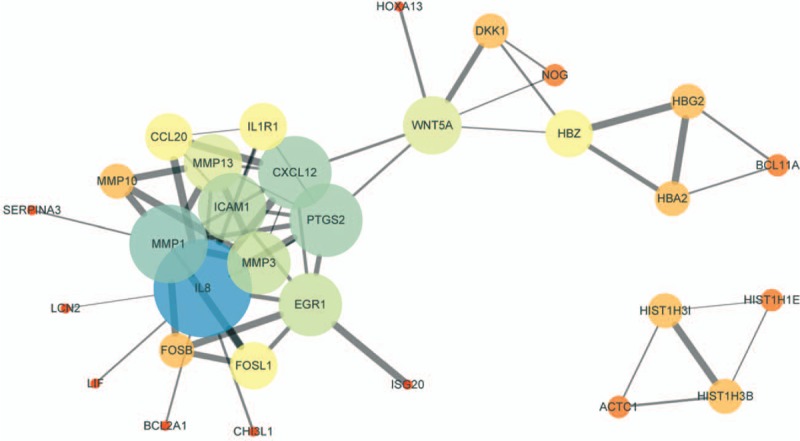
Figure 4.

PPI network of top 30 DEGs was constructed and visualized by Cytoscape software. Low value of combined score to circle with small size or bright colors and line with small sizes. DEGs = differentially expressed genes, PPI = Protein-protein interaction.
