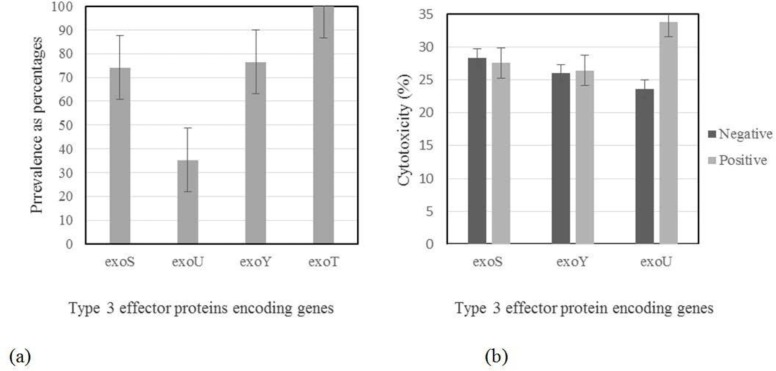
Fig. 1.
(a) Prevalence (as percentages) of the exoS, b: exoU, c: exoY, d: exoT genes among isolates. Error bars represent standard errors. (b) Correlation of exo genes existence with cytotoxicity of A549 cells. Error bars represent standard errors. Because of observing exoT in all isolates, data related to this gene is not presented in this figure.

