
Fig. 9.
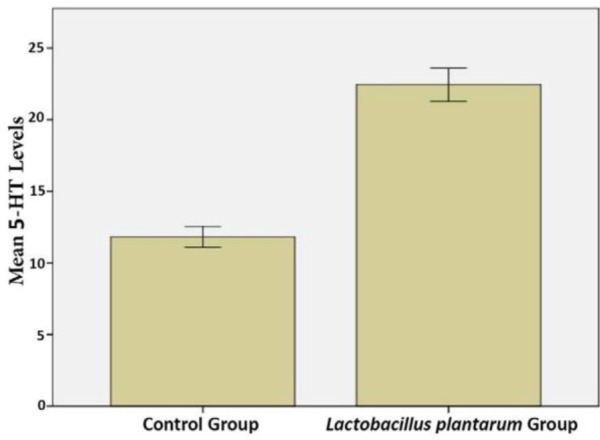
Quantitative analysis of brain 5-HTT levels in L. plantarum IS-10506 treated and control rats. Data represent mean ± SE (n = 10/group).
Official websites use .gov
A
.gov website belongs to an official
government organization in the United States.
Secure .gov websites use HTTPS
A lock (
) or https:// means you've safely
connected to the .gov website. Share sensitive
information only on official, secure websites.
Quantitative analysis of brain 5-HTT levels in L. plantarum IS-10506 treated and control rats. Data represent mean ± SE (n = 10/group).