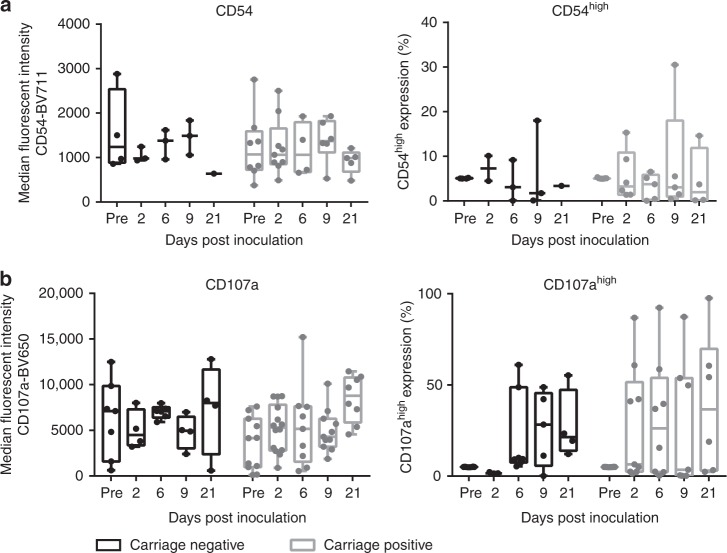
Fig. 2.
Epithelial surface marker expression in vivo is unaltered during colonisation of S. pneumonia. Epithelial cells from nasal curette biopsies were analysed by flow cytometry for a CD54 and b CD107a. Results were expressed as median fluorescence intensity (left) and high cell surface expression (≥95% of the baseline expression, right) representing at least two volunteers per time point who were carriage negative (black) and carriage positive (grey). Comparisons between carriage negative and carriage positive, on each day of sampling, was analysed by one-way ANOVA (a—parametric, b—non-parametric). P = 0.84 CD54 MFI; P = 0.98 CD54 %; P = 0.09 CD107a MFI; P = 0.10 CD107a %. Boxplots represent the median (centre line) and interquartile range (box), minimums and maximums (whiskers)

