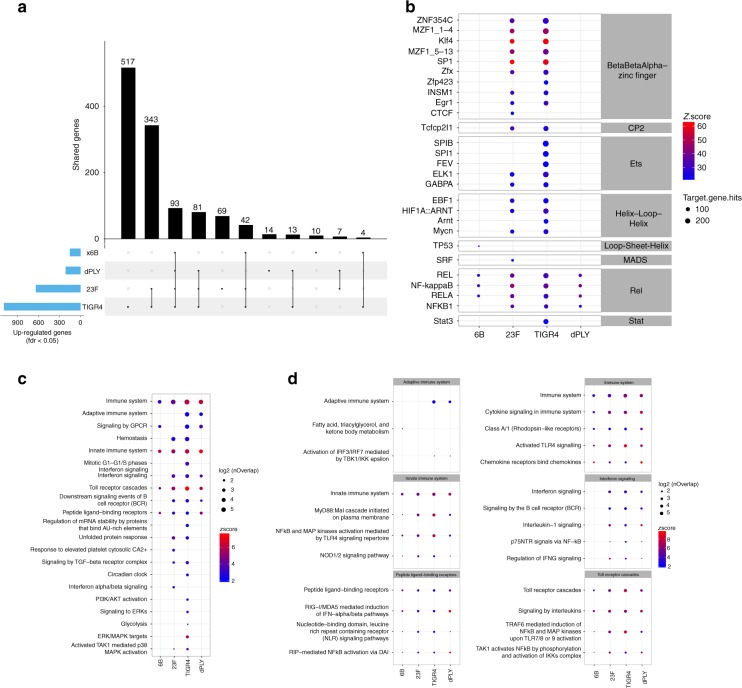
Fig. 6.
Transcriptomic responses to S. pneumoniae in vitro are influenced by adhesion and micro-invasion. a The total number of Detroit 562 epithelial genes upregulated following exposure to 6B, 23F, TIGR4 and TIGR4-dPly pneumococci, compared with non-infected samples. N = 3 independent experiments with replicates. Genes with an FDR <0.05 were considered for further analysis. The matrix shows intersections for the four strains, sorted by size. Dark circles in the matrix indicate sets that are part of the intersection. b Bubble heatmap showing the results of transcriptional factor analysis in Opossum for each strain. Transcriptional factors are ordered by family and then sorted by number of genes in the database. The colour represents the log2 z-scores (a continuum from blue (lowest values) to red (highest values)) and the size shows the number of genes annotated to the particular pathway. c Bubble heatmap showing the results of reactome pathway analysis for upregulated genes in each strain compared with non-infected cells. Pathways were clustered in 20 groups using K-means on Jaccard index and the biggest pathway for each group was selected for representative annotation of each cluster. Individual pathways within clusters are shown in Supplementary Fig. 8. The colour represents the log2 z-scores (a continuum from blue (lowest values) and red (highest values)) and the size shows the number of genes annotated to each pathway. d Selected bubble heatmap clusters representing the individual pathways within each cluster from (c)

