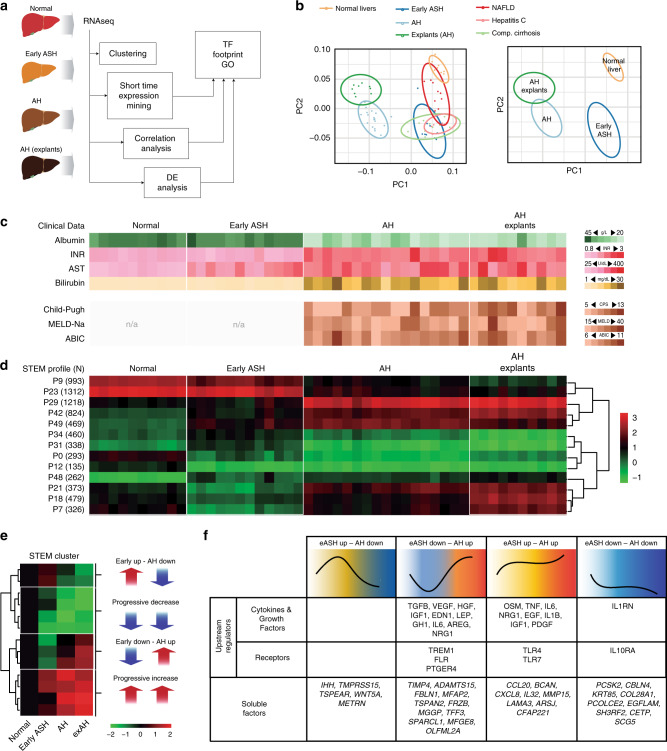
Fig. 1.
Liver transcriptome encompasses disease progression in patients with ALD. a Human phenotypes included in the RNA-seq analysis: normal human livers (n = 10), early ASH (n = 12), AH (n = 18) and explants from AH patients (n = 11). Diseased controls: liver biopsies from patients with NAFLD (n = 9), non-cirrhotic HCV (n = 9) and compensated cirrhosis (n = 9). Unbiased clustering and Short Time Expression Miner (STEM) algorithm were used to group patients by RNA profiling and to identify main time-correlated patterns of expression. Kendall rank correlation coefficient and differential expression analysis (limma) between “Normal” and “Early ASH” and between “Early ASH” and “AH” groups was performed. Motif enrichment analysis (Opossum) and network analysis (Ingenuity Pathway Analysis) were used to identify main transcription factors involved in gene expression changes. b A schematic summary of Principal component analysis (PCA). c Heatmap of clinical and laboratory data of ALD patients: (Top) liver function tests: albumin serum levels, International Normalized Ratio (INR), aspartate aminotransferase (AST) and total serum bilirubin levels; (Bottom) Liver prognostic scores including Child-Pugh, MELD and ABIC; The color scale on the right indicates the range of each laboratory or clinical parameter. d Heatmap of STEM results, showing average expression (normalized log counts) of main groups of genes based on gene enrichment profile expression. Left column: STEM profile and number of genes. On top, patient phenotypes. Right panel, hierarchical clustering of profiles. See Supplementary Fig 2 for additional data from STEM analysis. e Heatmap of STEM results showing mean counts for all pattern-grouped genes for patients belonging to each disease stage. In the right panel, schematic representation (thick arrows) of main time-related expression patterns. f IPA analysis showing upstream regulators and soluble factors for each of four general expression pattern clusters. Regulators identified as cytokines, growth factors and receptors with a threshold ZS of 2 are presented (top-middle). Among the most 100 differentially expressed genes for each analysis, genes encoding secreted proteins are presented (bottom)

