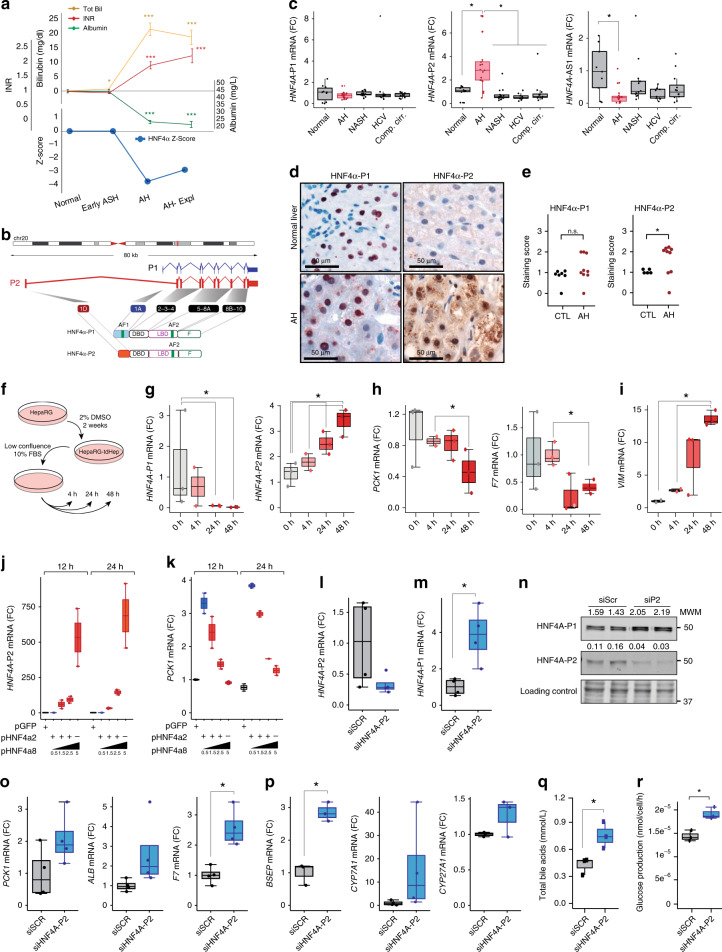
Fig. 3.
Fetal HNF4α-P2 isoform increase in patients with AH and its effect in HNF4α-P1. a Levels of bilirubin, INR and albumin levels in serum along ALD progression (values expressed as Mean ±SEM) and HNF4α footprint Z-Score. b Scheme of HNF4A gene fetal (P2) and adult (P1) isoforms structure and protein variants. c Real-Time quantitative PCR (qPCR) of HNF4A-P1 and P2 dependent isoforms, and lncRNA HNF4A-AS1 in the cohort of patients in Fig. 1. d Immunohistochemical detection of adult and fetal HNF4A protein variants in patients with AH (n = 9), and controls (n = 9), using N-terminal specific antibodies. e Semi-quantitative assessment of IHC signal for each antibody for nuclear staining. f–i HepaRG cells were retro-differentiated into tumor-derived Hepatocyte-like cells (HepaRG-tdHep); de-differentiation was induced with FBS and RNA was extracted at 4, 24, and 48 h (n = 3 for each time point); qPCR of g HNF4α-P1 and P2 isoforms, h phosphoenol-pyruvate carboxy-kinase (PCK1), clotting Factor VII (F7) and i vimentin (VIM) j, k HepG2 cells were transfected with plasmids encoding P1 (HNF4α2) and P2 (HNF4α8) variants. P1 was maintained at same dose while P2 was increased as indicated. RNA was extracted 12 h and 24 h after transfection (n = 3); qPCR of j HNF4α-P2 isoform and k PCK1. l–p HepG2 cells were transfected with siRNA targeting the first exon (1E) of HNF4α-P2 isoforms (n = 3), and RNA and protein was extracted at 48 h after transfection. qPCR of l HNF4α-P2 and m HNF4α-P1. n Western blot of HNF4α-P1 and HNF4α-P2 in nuclear extracts. qPCR of HNF4α-P1 targets related to o metabolic functions (PCK1, ALB and F7) and p bile acid synthesis and transport (BSEP, CYP7A1 and CYP27A1). q, r Primary human hepatocytes were silenced with siRNA-HNF4A-P2. q Supernatant was collected 48 h after transfection (n = 3 for each group) and total bile acids were quantified. r Glucose production in P2-silenced primary human hepatocytes. Significance was determined by unpaired, two-tailed Student’s t-test in a and c, by Fisher exact probability test in d, e and by two-tailed Mann–Whitney U test in g, i, l, m, o, p, q, r: *P < 0.05. For box-and-whisker plots: perimeters, 25th–75th percentile; midline, median; individual data points are represented

