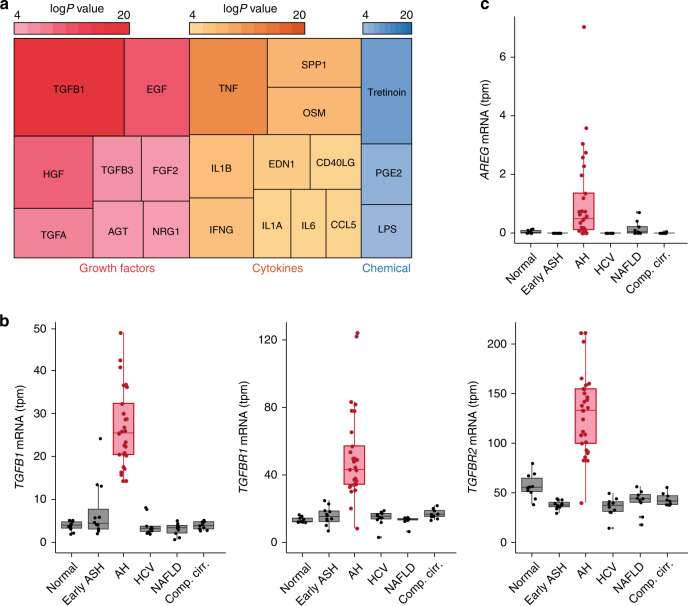
Fig. 4.
TGFβ1 is the main upstream regulator of transcriptomic reprogramming in ALD. a Treemap of the top predicted activated growth factors, cytokines and chemicals as detected by IPA. Color and box areas are related to p-values, indicated in top-right color-scale. Most significant hits (P < 10−4) are shown. b, c mRNA abundance in transcripts per million (tpm) from normal livers, AH livers and livers of non-alcohol-related chronic disease of b TGFβ1, TGFβRI, and TGFβRII and c Amphiregulin (AREG). For box-and-whisker plots: perimeters, 25th–75th percentile; midline, median; whiskers, minimum to maximum values; individual data points are represented. Gene expression levels are presented in transcripts per million reads (tpm)

