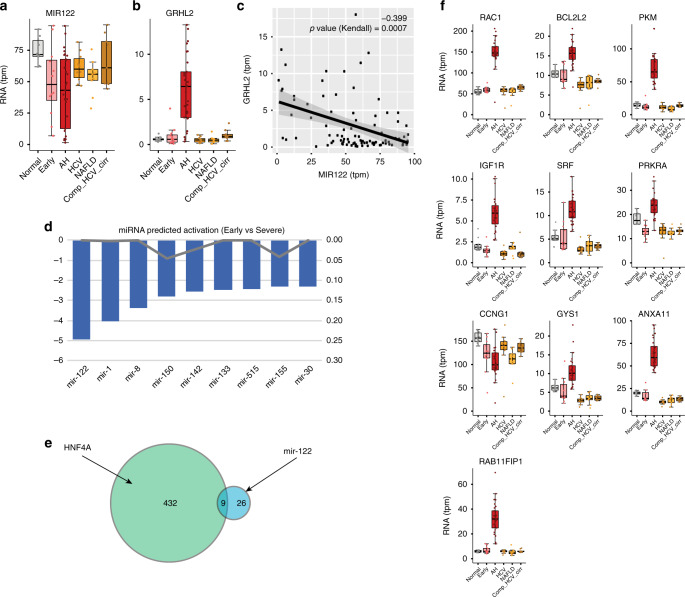
Fig. 7.
miR122 levels and miR122 predicted downregulation in AH patients. a RNA levels of hpri-miR122 in our cohort b levels of Grainyhead Like Transcription Factor 2 (GRHL2) in our cohort c correlation of GRH2L2 and MIR122 levels. R and p value (Kendall) are presented. d Results of miRNA predicted activity by means of IPA Upstream Regulator analysis when comparing early ASH vs AH. Top 8 miRNA are presented. e Venn diagram of the overlap between HNF4A and MIR122 targets among the differentially expressed genes in the comparison between early ASH and AH. f Box plot of most 10 validated miR122 targets (miRTarBase database) in our cohort. Box-and-whisker plots indicate 25th–75th percentile; midline, median; whiskers, minimum to maximum values; individual data points are represented. In bold, those genes that reached FDR < 10−6 level of significance in DESeq2 differential expression analysis between early ASH and AH. For box-and-whisker plots: perimeters, 25th–75th percentile; midline, median. Gene expression levels are presented in transcripts per million reads (tpm)

