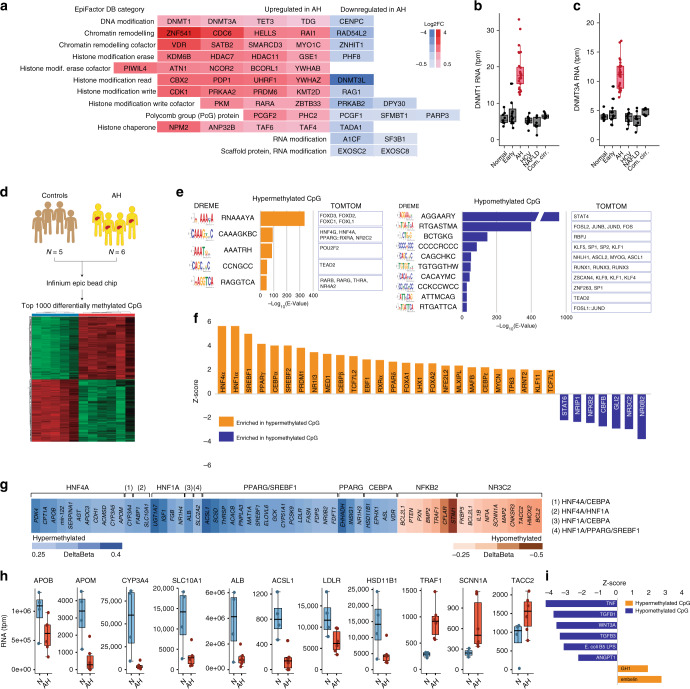
Fig. 9.
DNA hypermethylation of HNF4α-targets in AH patients. a Heatmap of Log Fold Changes in the expression of main epigenetic modulators in AH patients. Genes are organized by the 12 family of factors described in EpiFactor Database. b, c mRNA abundance in transcripts per million (tpm) from normal livers, AH livers and livers of non-alcohol-related chronic disease of b DNA Methyl-Transferases DNMT1 and c DNMT3A. d–i DNA extracted from 5 Normal and 6 AH livers was bisulfite treated and hybridized in Illumina Infinium MethylationEPIC chip. d heatmap of top 2000 hyper or hypomethylated CpG islands. e DREME and TomTom algorithms (MEME-ChIP suite) were used to search for de novo transcription factor binding sites (tfbs) in hyper and hypomethylated regions and to identify transcription factors known to match these tfbs, respectively. f Differentially methylated regions were gene annotated (nearest-feature) and Ingenuity Pathway Analysis (IPA) was used to predict which transcription factor are predicted to be an upstream regulator genes with DM CpGs. Intensity of the enrichment is presented as Z-Score (p < 0.01). g Selected TF target genes delta-β changes: values are expressed with blue-color gradient if hypermethylated and brown-color if hypomethylated. h RNA sequencing of the same samples used in methylation chip was used to validate potential functional impact of hyper/hypomethylation on gene expression. i IPA analysis of soluble factors upstream the hyper and the hypomethylated region. Intensity of the enrichment is presented as Z-Score. For box-and-whisker plots in b, c, h: perimeters, 25th–75th percentile; midline, median. Gene expression levels are presented in transcripts per million reads (tpm)

