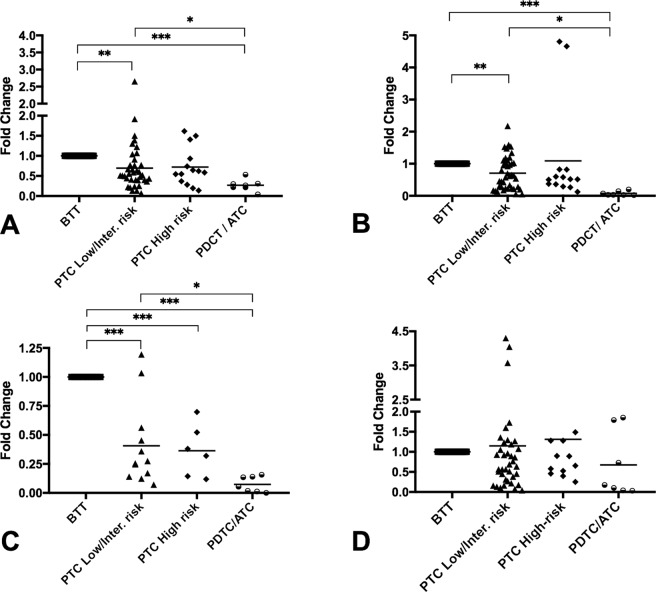
Figure 2.
Analysis of the gene expressions by qRT-PCR in human thyroid tumors. (A) HMGR gene expression, (B) CYP7B1 gene expression, (C) LXR gene expression, (D) CYP27A1 gene expression. The patient cohort was divided into the following groups: BTT (n = 32), low/intermediate-risk PTC (n = 37), high-risk PTC (n = 12), and PDTC/ATC (n = 7). Endogenous expression of the GADPH gene was used to normalize the data, and BTT was used as calibrator tissue. Statistical analysis: ANOVA test plus Tukey’s post-test (*p < 0.05, **p < 0.01, ***p < 0.001).

