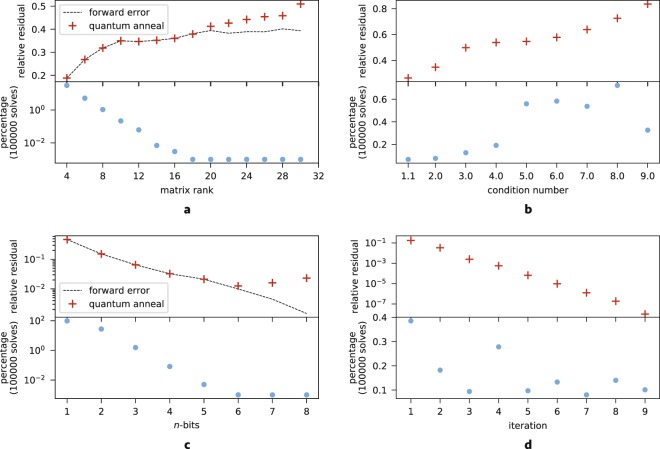
Figure 2.
(a) (Top) The black dashed line shows the theoretical minimum relative residual of the algorithm as predicted by minimizing the forward error, given the search precision and search range used for the test. The red crosses are results of the lowest energy state from 100,000 quantum annealing measurements. Physical measurements deviate from the theoretical minimum as problem size grows. (Bottom) The corresponding percentage of measurements in the minimum energy state are shown in blue. The vertical axis is shown in a logarithmic scale. (b) Analogous to (a) but for varying condition number. The forward error prediction (dashed black line) is omitted and not a reliable measure of the relative residual for larger condition numbers. Note that the vertical axis of the bottom plot showing the percentage of measurements observed in the lowest-lying state is on a linear scale. (c) This plot is analogous to (a) but for varying search precision. Note that both vertical axes are on a logarithmic scale. (d) (Top) The relative residual exponentially decreases with each iteration of the algorithm. By the ninth iteration the result reaches single precision. (Bottom) The percentage of quantum annealing solutions in the lowest-lying state. The algorithm successfully resolves the solution at single precision for this example without issue.

