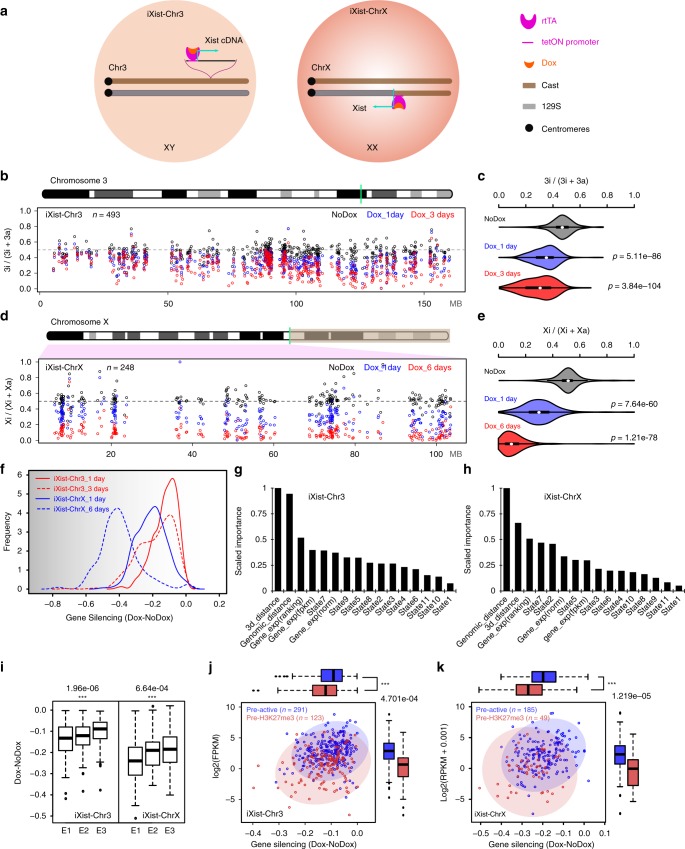
Fig. 1.
mESC models for analysis of Xist-mediated silencing. a Schematic summarising engineering of iXist-Chr3 and iXist-ChrX mESCs. b Allelic silencing across Chr3 in uninduced (NoDox), 1 day and 3 days induced (Dox) iXist-Chr3 cells. Mean value of allelic ratio for each gene with an informative SNP was calculated from biological replicates as detailed in Supplementary Table 4. Green line on Chr3 ideogram indicates location of Xist transgene. c Violin plot summarising distribution of ratio values in b. p values were calculated by one-sided Wilcoxon rank-sum test. d Allelic silencing on ChrX in uninduced (NoDox), 1 day and 6 days induced (Dox) iXist-ChrX cells. Mean value of allelic ratio for each gene with an informative SNP was calculated from biological replicates as detailed in Supplementary Table 4. Green line on ChrX ideogram indicates location of Xist locus. e Violin plot summarising data in d. p values were calculated by one-sided Wilcoxon rank-sum test. f Comparison of gene silencing in iXist-Chr3 and iXist-ChrX cell lines. g, h Importance of parameters for predicting silencing efficiency in iXist-Chr3 (g) and iXist-ChrX (h) cells using machine learning. AUC (area under the curve) is 0.70 and 0.71 for iXist-Chr3 and iXist-ChrX, respectively. i Allelic silencing for quantiles E1–E3 based on mESC gene expression level in iXist-Chr3 and iXist-ChrX mESCs 1 day after Xist RNA induction, where E1 is lower expressed gene group and E3 is the highest, with significance indicated using one-way ANOVA test. j, k Scatterplots and boxplots illustrating more efficient silencing of genes that have pre-existing mESC H3K27me3 (pre-H3K27me3) chromatin/low expression level in iXist-Chr3 cells (j) and iXist-ChrX cells (k). p values calculated using two-sided Wilcoxon rank-sum test. For all the boxplots (i–k) the lower and upper edge of the box represent the first and third quartile, respectively. The horizontal line inside the box indicates the median. Whiskers identify the farthest data points within 1.5× the interquartile range (IQR)

