Fig. 3.
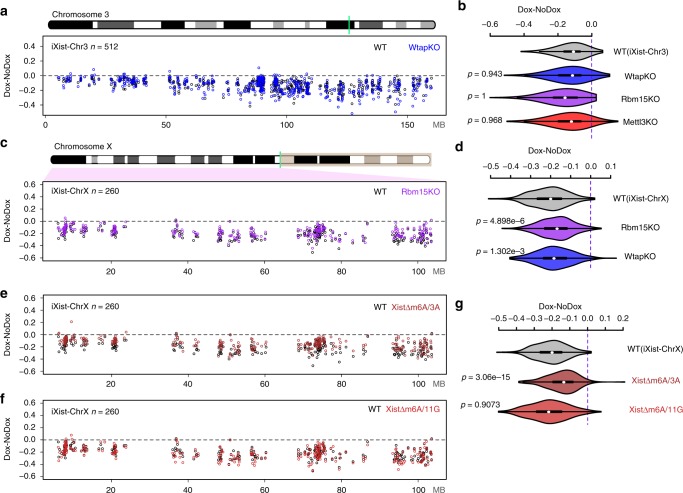
The role of Rbm15/m6A-MTase complex in Xist-mediated silencing. a Allelic silencing across Chr3 after 1 day of Xist RNA induction in WT and Wtap null (KO) iXist-Chr3 cells. Mean value of difference of allelic ratio for each gene with an informative SNP was calculated from biological replicates as detailed in Supplementary Table 4. Green line on Chr3 ideogram indicates location of the Xist transgene. b Violin plot summarising data for Wtap null in a, and additionally, data for Mettl3 mutant and Rbm15 null shown in Supplementary Fig. 3c. P values were calculated using one-sided Wilcoxon rank-sum test. c Allelic silencing across ChrX after 1 day of Xist RNA induction in WT and Rbm15 null (KO) iXist-ChrX cells. Mean value of difference of allelic ratio for each gene with an informative SNP was calculated from biological replicates as detailed in Supplementary Table 4. Green line on ChrX ideogram indicates location of the Xist locus. d Violin plot summarising data in c. P values were calculated using one-sided Wilcoxon rank-sum test. e, f Allelic silencing across ChrX after 1 day of Xist RNA induction in WT and cell lines with deletions within the major m6A peak region, XistΔm6A/3A (e) and XistΔm6A/11 G (f) in iXist-ChrX cells. Mean value of difference of allelic ratio for each gene with an informative SNP was calculated from biological replicates as detailed in Supplementary Table 4. g Violin plot summarising data in e, f. P values were calculated using one-sided Wilcoxon rank-sum test

