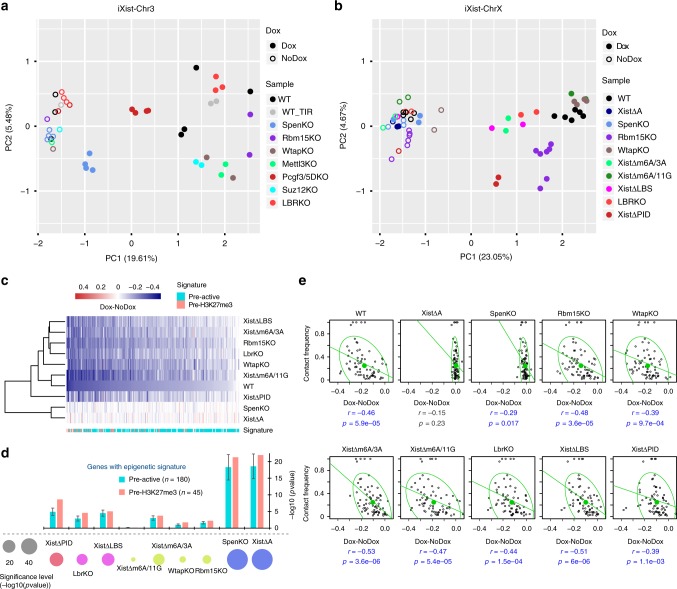
Fig. 7.
Integrated analysis of key pathways in Xist-mediated silencing. a, b PCA analysis of biological replicates of ChrRNA-seq analysis for all uninduced and Xist-induced experiments in iXist-Chr3 (a) and iXist-ChrX (b) for WT and mutants. c Cluster analysis and heatmap for silencing efficiency of ChrX genes in selected mutant mESCs, as indicated after 1 day of Xist RNA induction. Gene order is ranked by silencing efficiency in WT iXist-ChrX cells. Chromatin signature defined by ChromHMM is shown below. d Silencing levels in different mutants in iXist-ChrX cells illustrated as one-sided Wilcoxon rank-sum significance. Bar charts illustrate separate significance scores for genes classified according to pre-existing active (pre-active) and H3K27me3 (pre-H3K27me3) chromatin signatures, corrected for sample size. Error bars indicate significance range for 180 permutations. e Correlation analysis for topological distance and silencing efficiency for WT and selected mutant mESCs in iXist-ChrX model. Ninety-five per cent of the population is encircled. Spearman correlation and p values are indicated below

