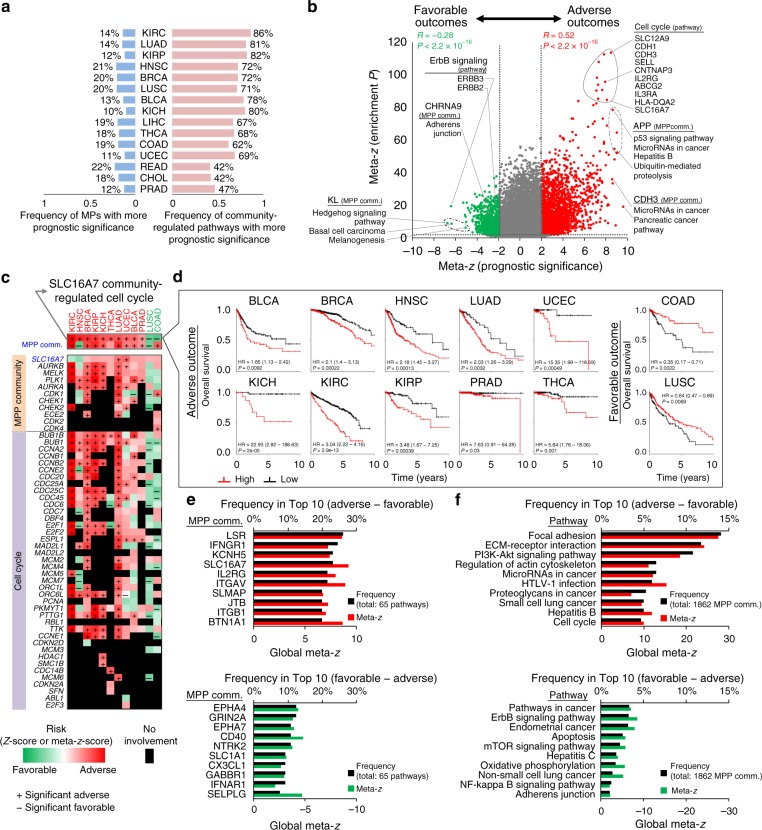
Fig. 4.
Prognostic landscape of cancer membrane protein-regulated networks (CaMPNets) in 15 cancer types. a Comparison of prognostic significance between the membrane protein (MP) itself (blue) and the community-regulated pathways (pink) in 15 cancers. b Volcano plot of the meta-z-scores of adverse (red; e.g., SLC16A7 community-regulated cell cycle) and favorable (green; e.g., KL community-regulated hedgehog signaling pathway) prognostic community-regulated pathways (x axis) versus the meta-z-scores of the enrichment P values of pathways (y axis) across cancers. The gray dots represent non-enriched community-regulated pathways (meta-z < 1.64 or nominal one-sided P > 0.05) and insignificant prognostic pathways (|meta-z| < 1.96 or nominal two-sided P > 0.05). c Heat map of SLC16A7 community-regulated cell cycles in CaMPNets showing survival outcomes of gene members in different cancer types. Statistical significances described by z-scores (or meta-z-score) for associations with adverse prognostic genes (or gene sets) are shown in red, favorable prognostic genes (or gene sets) are shown in green, and genes not involved in the CaMPNets are in black. The positive (+) and negative (−) signs indicate significant adverse and favorable prognostic genes (or gene sets) with P < 0.05 (log-rank test). d Kaplan–Meier plots representing patients stratified by the auto-select best cutoff (25–75%) for high or low combined scores (see “Methods”) of genes in the SLC16A7 community-regulated cell cycle across 12 cancers. Among the 12 cancer types, SLC16A7 community-regulated cell cycles in most cancers have significant adverse outcomes, except for colon adenocarcinoma (COAD) and LUSC, which have favorable outcomes. The 95% confidence intervals are displayed in parentheses. HR, hazard ratio. e The ten most frequent cancer-wide adverse (top) and favorable (bottom) prognostic MPP (an MP with binding partners) communities (y axis) considering 65 cancer-related pathways. Notably, the frequencies of pathways for MPP communities with significant adverse and favorable outcomes are subtracted by those with significant favorable and adverse outcomes, respectively. f Top 10 frequencies of adverse (top) and favorable (bottom) prognostic pathways (y axis) for 1862 MPP communities in 15 cancers. The global meta-z-score of each MPP community and each pathway reflect 65 pathways and 1862 MPP communities in all cancers, respectively. Source data are provided as a Source Data file

