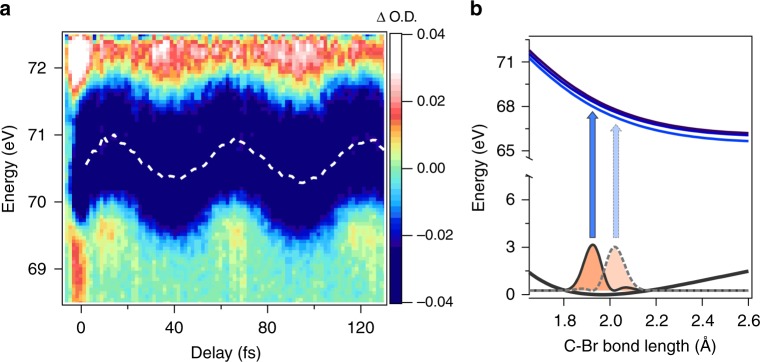
Fig. 4.
Ground State Vibrational Wavepacket in CH3Br. a Zoom into the portion of the attosecond transient absorption trace depicting the ground-state vibrational wavepacket from process 2. A clear center-of-energy oscillation is visible in the transient absorption spectrum (vibrational period of T = 53.9 ± 0.2 fs) due to the wavepacket motion of the RC–Br bond. b Qualitative picture demonstrating how the time dependence of the RC−Br bond can trace out different M4,5 transition energies

