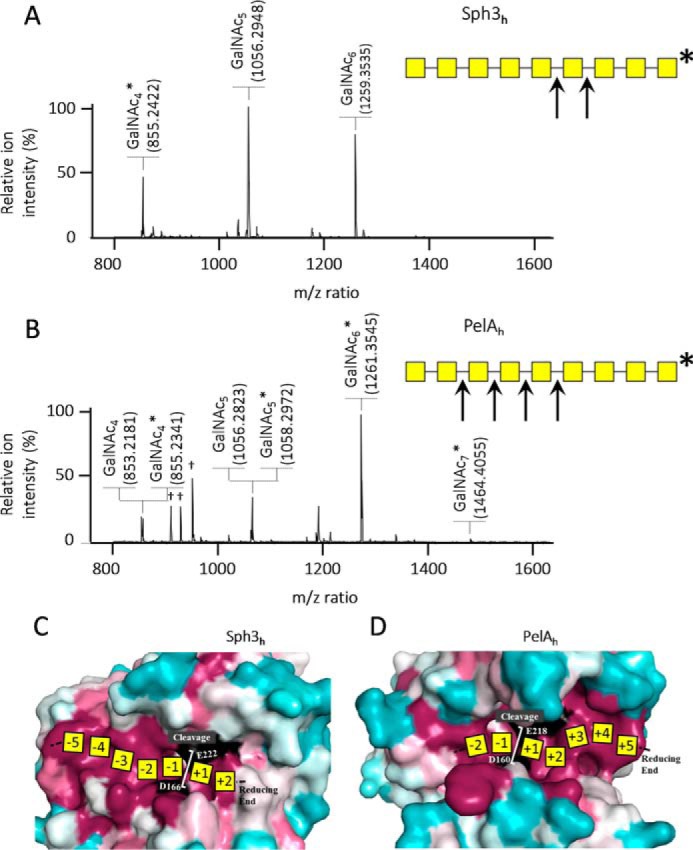
Figure 7.

Sph3h and PelAh do not hydrolyze the oligosaccharide at the same location. A, MALDI-TOF MS spectra of the enzymatic product of Sph3h and B, PelAh cleavage of reduced α-1,4-GalNAc 9-mers and their associated schematic view of the cleavage sites. Yellow squares represent GalNAc; arrows indicate enzymatic cleavage sites; * indicates the reducing end of the oligosaccharides; † indicates matrix ion signals. C, surface representation colored by conservations (conserved in magenta and variable in teal, catalytic residues in black) showing a proposed map of a heptamer substrate and product subsites on Sph3h, and D, PelAh.
