
Figure 10.
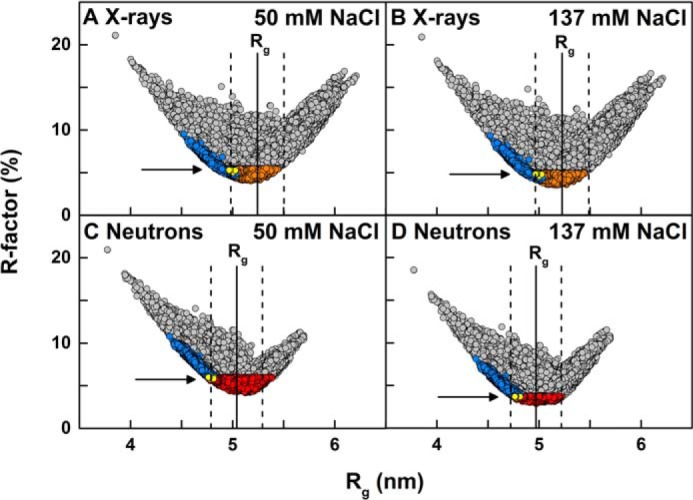
Modeling analyses for IgG2. The 123,371 goodness-of-fit R-factors were compared with the X-ray and neutron Rg values calculated for the IgG2 models. All 123,371 models are shown in gray. The 5,242 models filtered using an α-carbon separation of 0.75 nm for each of the four pairs of cysteine residues in the hinge (Fig. 1) are shown as blue circles. The 13 best-fit models that were accepted for each X-ray and neutron pair according to three filters (X-ray and neutron R-factor cutoffs and disulfide separations) are shown as yellow circles and arrowed. The experimentally observed Guinier Rg values are shown by vertical solid lines with error ranges of ± 5% shown by dashed lines. A, hydrated X-ray models were compared with the experimental X-ray curve of 0.5 mg/ml IgG2 in PBS-50 where the orange circles show 35,141 models with the R-factor below 5.5%. B, hydrated X-ray models were compared with experimental X-ray curve of 1 mg/ml IgG2 in PBS-137, where the orange circles show 30,088 models with the R-factor below 5%. C, unhydrated neutron models were compared with the experimental neutron curve of 0.45 mg/ml IgG2 in PBS-50 in 100% 2H2O, where the red circles show 44,835 models with the R-factor below 6%. D, unhydrated neutron models were compared with the experimental neutron curve of 1 mg/ml IgG2 in PBS-137 in 100% 2H2O, where the red circles show 10,731 models with the R-factor below 3.75%.