
Figure 11.
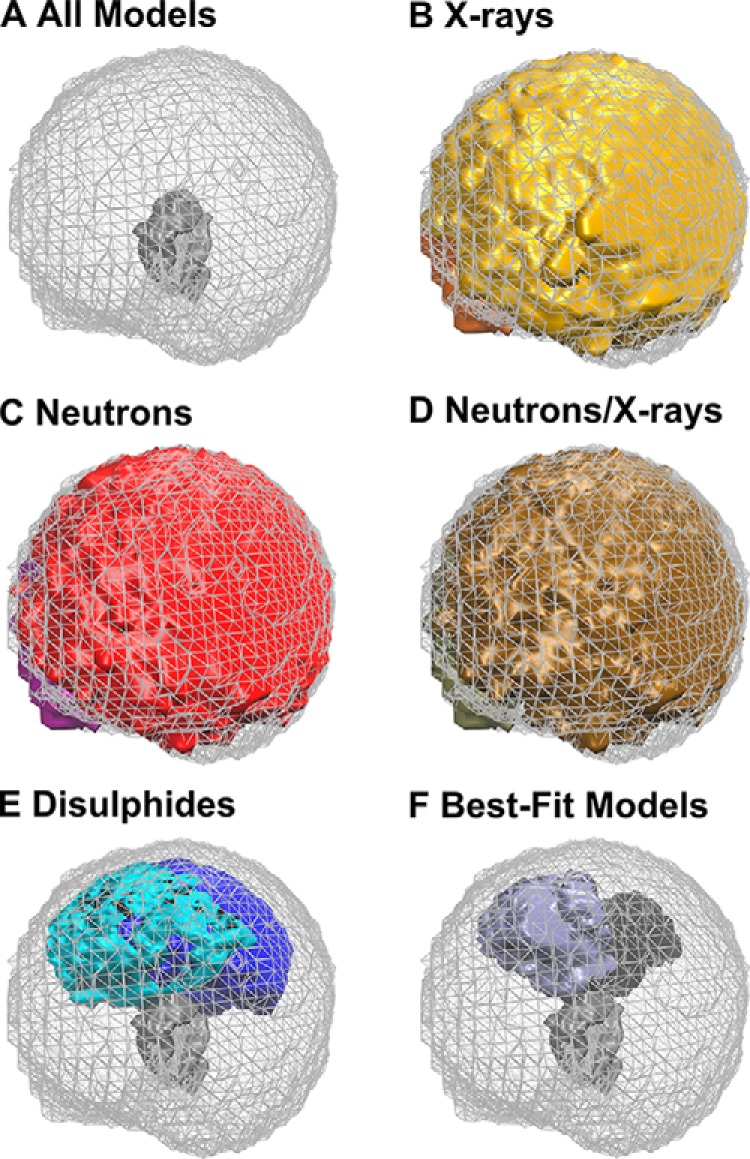
Density plots of the best-fit IgG2 models in PBS-137 buffer. The graphics were rendered using Tachyon in VMD. A, density plot for all 123,371 models is shown as a mesh with the Fc region shown as a gray solid surface. This is the reference for B–F. B, models that satisfied an X-ray R-factor cutoff below 5% for the curve at 1 mg/ml in PBS-137 in 100% light water. The two Fab regions are shown in gold and orange (30,088 models). C, models that satisfied a neutron R-factor cutoff of 3.75% for the curve at 1 mg/ml in PBS-137 in 100% heavy water. The two Fab regions are shown in red and purple (10,731 models). D, models that satisfied both the X-ray and neutron R-factors. The two Fab regions are shown in brown and tan (4,866 models). E, models that satisfied using an α-carbon separation of 0.75 nm between each of the four pairs of cysteine residues in the IgG2 hinge. The two Fab regions are shown in cyan and blue (5,242 models). F, 13 final best-fit models for IgG2 in PBS-137 that meet the X-ray and neutron R-factor cutoff and disulfide filters. The two Fab regions are shown in purple and black (13 models).