
Figure 13.
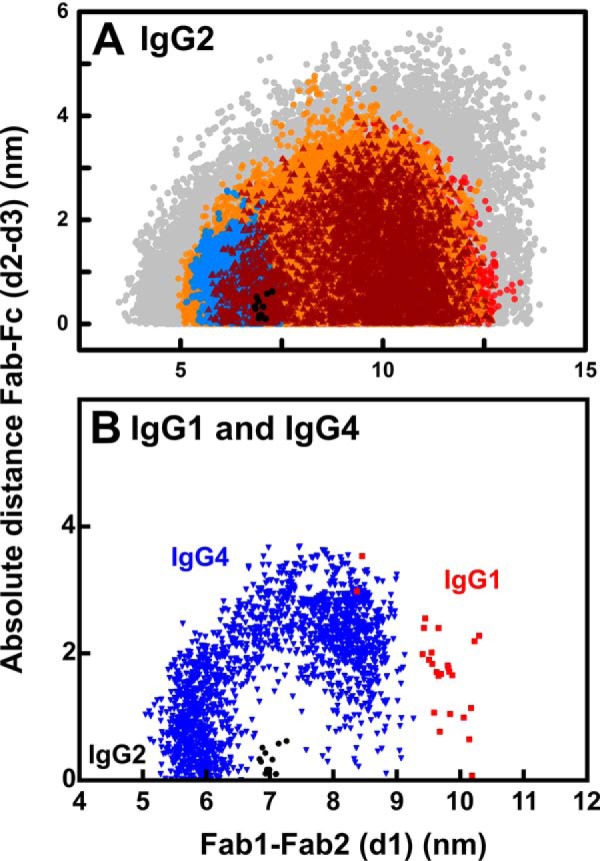
Distribution of the Fab–Fab and Fab–Fc distances in human IgG2. The analyses are shown for 1 mg/ml IgG2 in PBS-137. The inter-Fab distance, d1, between the center–of–mass of the two Fab arms and the absolute difference in Fab to Fc distances, d2–d3, are shown (Fig. 1). A, all 123,731 models from the Monte Carlo simulations are shown in gray. The 30,088 models with an X-ray R-factor below 5% are shown in orange. The 10,731 models with a neutron R-factor below 3.75% are shown in red. The 4,866 models filtered by both the X-ray and neutron R-factor filters are shown in brown. The 5,242 models that have less than 0.75 nm α-carbon separations for each of the four pairs of cysteine residues in the hinge are shown in blue. The 13 best-fit models that satisfy the X-ray and neutron and disulfide filters are shown in black. B, IgG2 models (black) denote those that meet the X-ray and neutron and disulfide filters from A and are compared with those for IgG1 (red) and IgG4 (blue) that were calculated in the same way.