
Figure 14.
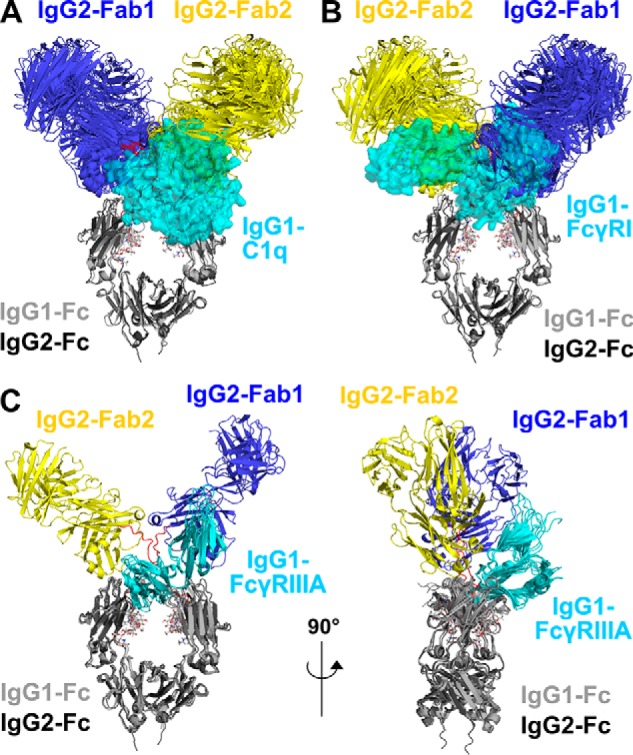
Superimposition of the nine IgG2 best-fit models with complement C1q and two Fc receptors. The nine IgG2 best-fit models are compared with crystal structures for the IgG1–C1q, IgG1–FcγRI, and IgG1–FcγRIII complexes. Superimpositions of the Fc regions of the IgG2 models with the crystal structures of the Fc complexes were achieved using the “align” function of PyMOL. The IgG2 Fab regions are shown in blue (Fab1) and yellow (Fab2) and the Fc region in dark gray as in Fig. 1. The Fc region is seen in the same view in A, B, and C (left), and it is rotated by 90° in C (right). The glycans in the IgG2 Fc region are represented as sticks, and the IgG2 hinge is represented as red loops. A, superimposition of the nine IgG2 best-fit models with the IgG1–Fc complex with the globular head of C1q (PDB code 6FCZ). The IgG1–Fc region is represented as a light gray cartoon, and C1q is represented as a cyan semi-transparent surface. B, superimposition of the nine IgG2 best-fit models with the IgG1–Fc complex with FcγRI (PDB code 4X4M). The IgG1–Fc region is represented as a light gray cartoon, and FcγRI is represented as a cyan semi-transparent surface. C, two orthogonal views at 90° of the superimposition of the IgG2 best-fit model with three crystal structures for the IgG1–Fc complexes with FcγRIIIA Val-158 (PDB codes 3SGJ, 5VU0, and 5YC5). The IgG1–Fc regions are represented as light gray cartoon schematics and FcγRIIIA are represented as cyan cartoons.