
Figure 4.
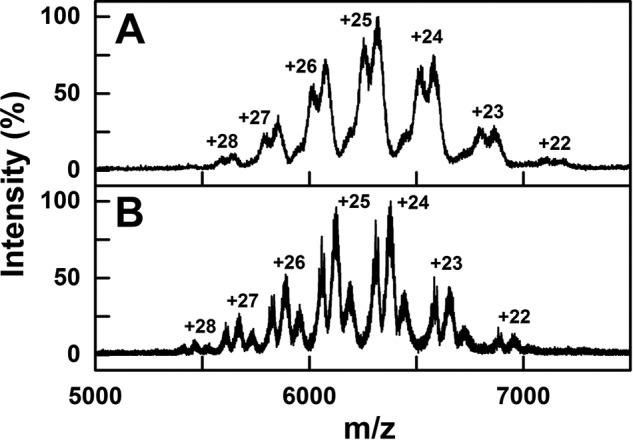
Native MS of glycosylated and deglycosylated IgG2. Native mass spectra of myeloma IgG2 are shown at an m/z between 5,000 and 7,500. The glycosylated and deglycosylated IgG2 mass spectra are shown in A and B, respectively. The theoretical charge states were generated using Amphitrite software and labeled.