
Figure 5.
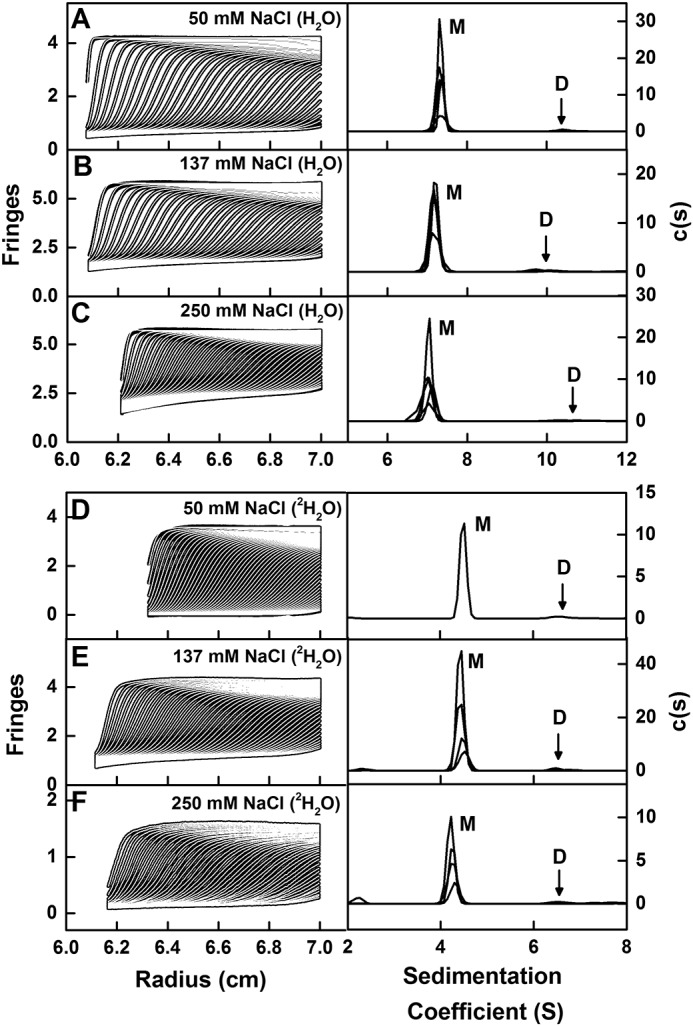
Sedimentation velocity analyses of IgG2. The experimentally observed sedimentation boundaries for IgG2 in the left panels in PBS-50 (A), PBS-137 (B), PBS-250 in H2O buffers (C), and in PBS-50 (D), PBS-137 (E), and PBS-250 (F) in 100% 2H2O buffers were recorded at a rotor speed of 40,000 rpm and 20 °C. Approximately 50 boundaries (black outlines) are shown from up to 300 scans for every sixth scan for clarity, and they were fitted using SEDFIT as shown (white lines). In the right panels, the corresponding size-distribution analyses c(s) are shown to reveal a major monomer (M) peak and a minor dimer (D) peak. The observed c(s) peaks are shifted to lower s values in 2H2O buffers.