
Figure 6.
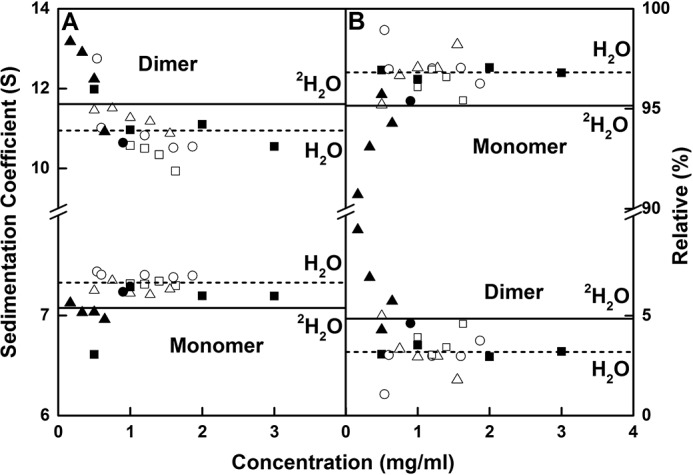
Sedimentation coefficient values and amounts of IgG2. A, s20, w values for the monomer and dimer peaks are shown as a function of IgG2 concentration in the six buffers of this study. B, percentages of monomer and dimer from the c(s) integrations. IgG2 is shown in PBS-50 (○), PBS-137 (□), and PBS-250 (▵) buffers in H2O at 20 °C and in PBS-50 (●), PBS-137 (■), and PBS-250 (▴) buffers at 20 °C in 100% 2H2O. The average s20, w values of monomer and dimer from the integration of the c(s) analyses for IgG2 are shown for H2O (- -) and 2H2O (—) buffers at 20 °C.