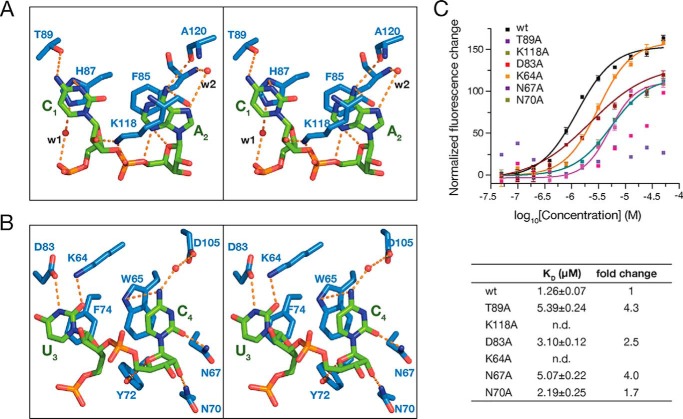
Figure 3.
Detailed interactions between the CAUC motif and YB-1 CSD. A, stereo view of the recognition of C1 and A2. B, stereo view of the recognition of U3 and C4. C, mutation of the key residues involved in the interactions decreases the binding as measured by FP (top). Changes in fluorescence intensity under polarized illumination were plotted. The derived KD is indicated. Error bars, S.D. (n = 3). WT and mutant YB-1 CSD are indicated in the key. The dissociation constants (KD) are summarized in the table (bottom).

