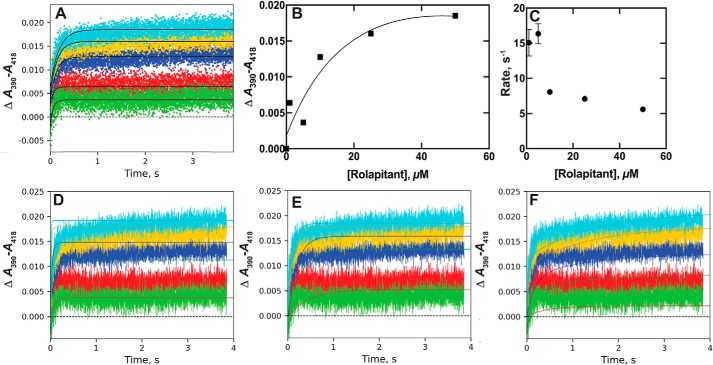
Figure 4.
Binding of rolapitant to P450 2D6. P450 2D6 (2 μm) was mixed with rolapitant (2 (green), 10 (red), 20 (dark blue), 50 (gold), and 100 (light blue) μm) (raw data presented previously (56)). A, single exponential fits of ΔA390–A418 traces. B, plot of ΔA390–A418 amplitude versus final concentrations of rolapitant (Kd,app ∼33 μm). C, plot of single exponential rate fits versus final rolapitant concentration. D, fits to a simple 2-state kinetic model (E + S ⇄ ES, Fig. 2) with k1 = 1.0 × 10⁶ m−1 s−1 and k−1 = 7.4 s−1 (ϵ390–418 5.3 mm−1 cm−1). E, fit to an induced-fit model (Fig. 2) with k1 = 1.1 × 10⁶ m−1 s−1, k−1 = 26 s−1, k2 = 9.6 s−1, and k−2 = 1.8 s−1 (ϵ390–418 5.7 mm−1 cm−1). F, fit to a conformational-selection model (Fig. 2) with k1 = 0.65 s−1, k−1 = 0.46 s−1, k2 = 0.19 × 106 μm−1 s−1, and k−2 = 2.0 s−1 (ϵ390–418 4.2 mm−1 cm−1).

