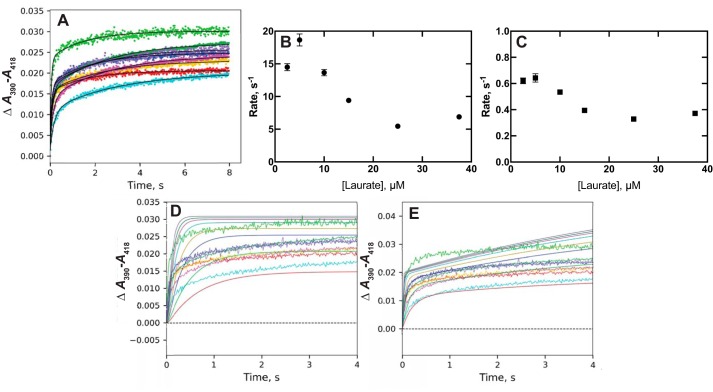
Figure 5.
Binding of lauric acid to P450 4A11. P450 4A11 (2 μm) was mixed with varying concentrations of lauric acid (5 (blue), 10 (red), 20 (magenta), 30 (gold), 50 (purple), 75 (dark green), and 150 (light green) μm). A, biexponential fits to traces of ΔA390–A418. B, plot of fast rate from A versus final concentration of lauric acid. C, plot of slow rate from A versus final concentration of lauric acid. D, fit of data (A) to an induced-fit model (Fig. 2) with k1 = 0.09 × 10⁶ m−1 s−1, k−1 = 8.5 s−1, k2 = 24 s−1, and k−2 = 0.73 s−1 (ϵ390–418 8.0 mm−1 cm−1). E, fit of data (A) to a conformational-selection model with k1 = 0.15 s−1, and k−1 = 0.25 s−1, k2 = 0.55 × 10⁶ m−1 s−1, and k−2 = 1.6 s−1 (ϵ390–418 9.5 mm−1 cm−1).

