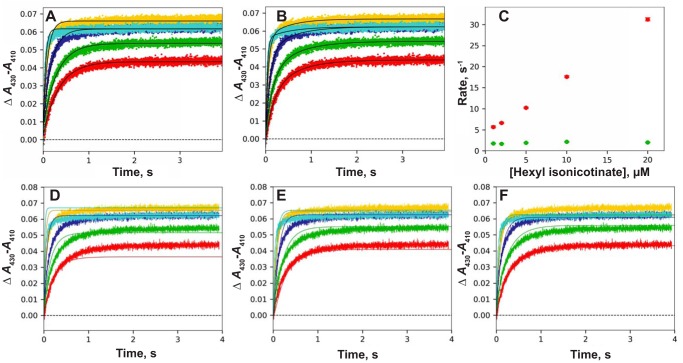
Figure 6.
Binding of hexyl isonicotinate to P450 2E1. P450 2E1 (2 μm) was mixed with hexyl isonicotinate concentrations of 1.0 (red), 2.0 (green), 5 (dark blue), 10 (light blue), and 20 (gold) μm. A, single exponential fits to traces of binding versus time. Linear regression analysis yielded kon = 0.98 × 10⁶ m−1 s−1 and koff = 1.3 s−1 (results not shown). B, biexponential fit of data of A. C, fast (red points) and slow (green points) rates of binding as a function of substrate concentration. D, fits of binding data with a 2-state model (solid lines) for varying concentrations of hexyl isonicotinate, with kon = 1.5 × 10⁶ m−1 s−1 and koff = 1.2 s−1. E, fits of data with an induced-fit model, with k1 = 1.9 × 10⁶ m−1 s−1, k−1 = 5.5 s−1, k2 = 15 s−1, and k−2 = 2.8 s−1 (ϵ430–410 19.5 mm−1 cm−1). F, fits of data with a conformational-selection model, with k1 = 18 s−1, and k−1 = 110 s−1, k2 = 10 × 106 m−1 s−1, and k−2 0.41 s−1 (ϵ430–410 15.5 mm−1 cm−1).

