Figure 7.
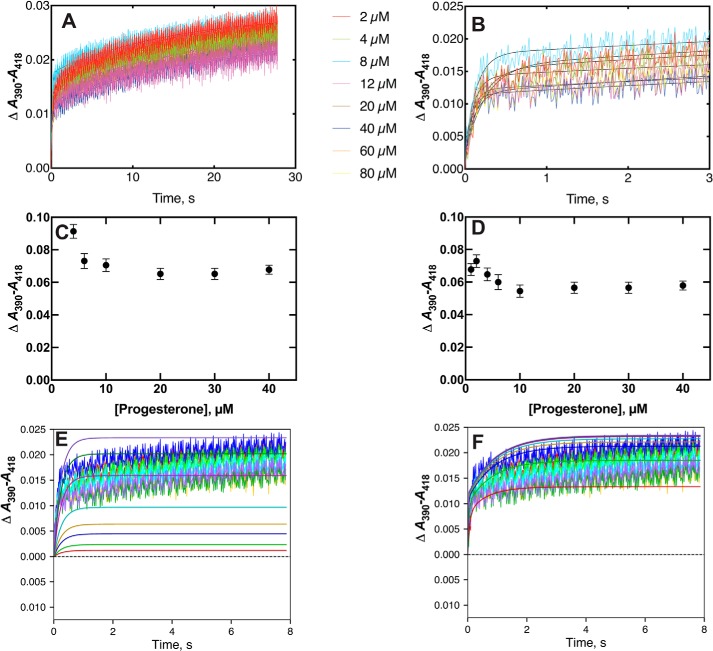
Binding of progesterone to P450 21A2. P450 21A2 (2 μm) was mixed with varying concentrations of progesterone (2 (red), 4 (green), 8 (dark blue, lower trace), 12 (gold), 20 (light blue), 40 (magenta), 60 (red), and 80 (dark blue, upper trace) μm). A, traces of ΔA390-A418 measured with varying concentrations of progesterone. B, expansion of early phase (first 3 s) of A. C, plot of single exponential rates of binding versus progesterone concentration. D, plot of rates of the slow phase of biexponential fits (A) versus progesterone concentration. E, fits of data with an induced-fit model, with k1 = 1.2 × 10⁶ m−1 s−1, k−1 = 100 s−1, k2 = 1.2 s−1, and k2 = 3.7 s−1 (ϵ390–418 46 mm−1 cm−1). F, fits of data with a conformational-selection model with k1 = 1.1 s−1, k−1 = 1.1 s−1, k2 = 6.6 × 10⁶ m−1 s−1, and k−2 = 2.2 s−1 (ϵ390–418 12 mm−1 cm−1).

