Figure 1.
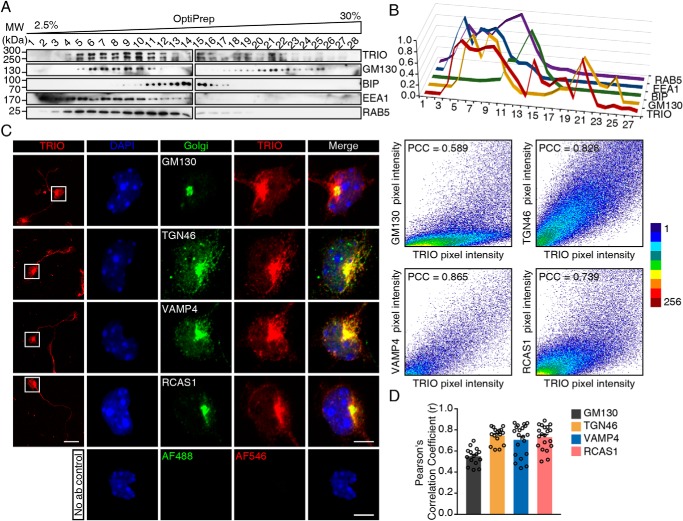
TRIO localizes to the Golgi apparatus in CGNs. A, P10 mouse cerebellum was homogenized, and the postnuclear supernatants were subjected to 2.5–30% OptiPrep density gradient for subcellular fractionation. Fractions were subjected to Western blotting with TRIO, GM130, BIP, EEA1, and RAB5 antibodies. B, relative distribution of blotted proteins in A, with the strongest intensity of each protein considered as 1. C, CGNs isolated from WT mice were cultured for 24–48 h and then stained with the antibody against Golgi markers GM130, TGN46, VAMP4, and RCAS1, as well as the TRIO-N antiserum and DAPI. The scale bar in the left panel represents 20 μm, and the scale bars in the right magnified panels represent 5 μm. Scatter plots and the PCCs of the fluorescence intensities of red and green channels are also shown. D, scatter plots and bar graph showing the PCC of TRIO and Golgi markers fluorescence intensities quantified from 15 to 20 neurons in each group, from three independent experiments. MW, molecular weight.

