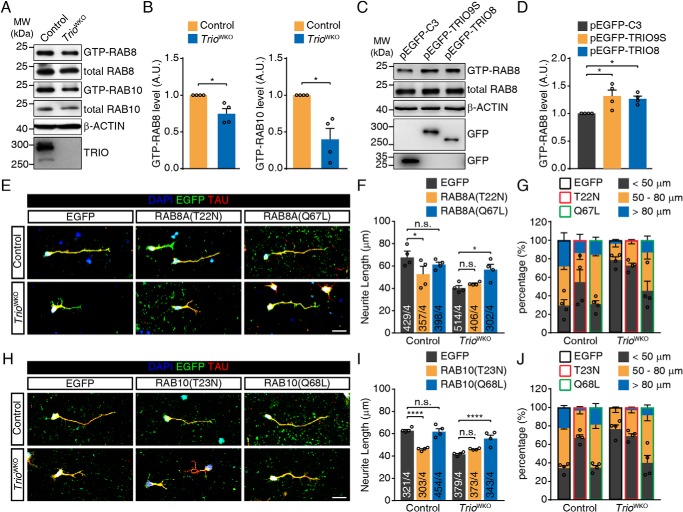
Figure 5.
RAB8/RAB10 activation is required for TRIO-mediated neurite outgrowth. A, GST–MICAL-L2-C pulldown assay to determine GTP-RAB8 and GTP-RAB10 level in cerebella isolated from P10 TrioWKO mice and littermate control mice. B, quantification of GTP-RAB8 and GTP-RAB10 levels in A. The error bars indicate S.E. (Student's t test). *, p < 0.05; n = 4. C, GST-JFC1 pulldown assay to determine GTP-RAB8 levels in Neuro-2a cells transfected with either the pEGFP-TRIO9S, pEGFP-TRIO8, or pEGFP-C3 plasmid. D, quantification of GTP-RAB8 levels in C. The error bars indicate S.E. (one-way ANOVA with Bonferroni's test). *, p < 0.05; n = 4. E, CGNs isolated from control or TrioWKO mice were transfected with either pcDNA–EGFP, pcDNA-RAB8A(T22N)-P2A-EGFP, or pcDNA-RAB8A(Q67L)-P2A-EGFP. Transfected neurons were cultured for 2 DIV, followed by staining with DAPI, EGFP, and Tau. The scale bar represents 20 μm. F, quantification of the neurite length in the images shown in E. The error bars indicate S.E. (two-way ANOVA with Tukey's test). *, p < 0.05; n = 4. Numbers of measured neurons are indicated in the columns. G, quantification of neurite length distribution in E. The error bars indicates S.E.; n = 4. H, CGNs isolated from control or TrioWKO mice were transfected with either pEGFP-C3, pEGFP–RAB10(T23N), or pEGFP–RAB10(Q68L) and then cultured for 2 DIV, followed by staining with DAPI, EGFP, and Tau. The scale bar represents 20 μm. I, quantification of the neurite length in the images shown in H. The error bars indicate S.E. (two-way ANOVA with Tukey's test). ****, p < 0.0001; n = 4. Numbers of measured neurons are indicated in the columns. J, quantification of the neurite length distribution in H. The error bars indicate S.E.; n = 4. A.U., arbitrary units; n.s., not significant; MW, molecular weight.

