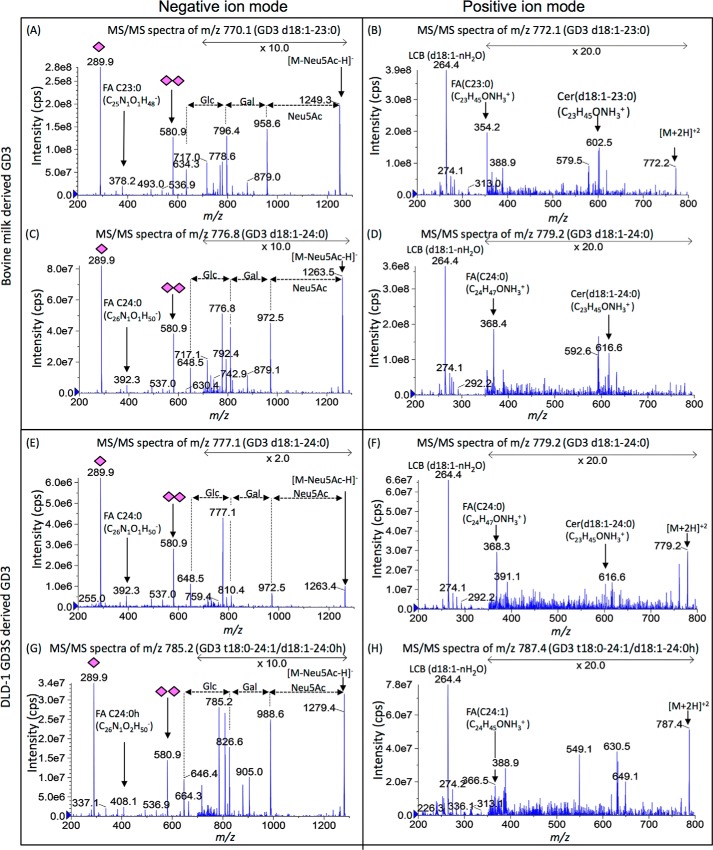
Figure 3.
MS/MS fragmentation for major components of bovine milk- and DLD-1 GD3S–derived GD3. To clarify differences in their GD3 structures, a major peak and a common peak were chosen. The m/z 770 and 777 in bovine milk–derived GD3 and m/z 785 and 777 in DLD-1 GD3S–derived GD3 with precursor ion scan of negative ion mode were analyzed by enhanced product ion scan (MS/MS) of negative and positive ion mode. The left column is negative ion mode for analysis of glycan and fatty acid. The right column is positive ion mode for analysis of long chain base and fatty acid. As shown in negative ion mode, there was no difference in their glycan structures (A, C, E, and G). FA C23:0 (m/z 378 and 354) were detected in A and B. FA C24:0 (m/z 392 and 368) was detected in C and D and E and F. FA C24:0 h (m/z 408) was detected in G. FA C24:1 (m/z 366) was detected in G. Therefore, m/z 770 in milk GD3 was identified as GD3 d18:1–23:0 (A and B). m/z 777 in milk GD3 and DLD-1 GD3S were identified as GD3 d18:1–24:0 (C–F). m/z 785 in DLD-1 GD3S was identified as GD3 t18:0–24:1/d18:1–24:0h (G and H).

