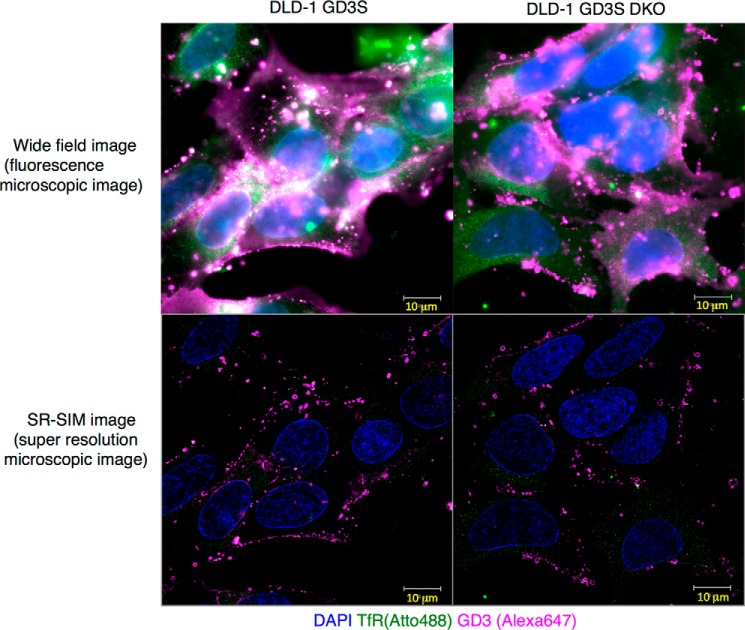
Figure 8.
Distribution patterns of GD3 as analyzed by ELYRA super-resolution microscope. Super-resolution imaging of GD3 on DLD-1 GD3S and the DES2/FA2H DKO cells was performed. Cells were seeded on glass coverslips (No. 11/2 high-performance, Zeiss) and fixed with 3% PFA + 0.1% glutaraldehyde PBS. They were reduced with 0.1% NaBH4 and blocked in 2.5% BSA and 5% normal goat serum. Mouse anti-GD3 mAb R24 and rabbit anti-TfR antibody (H-300, Santa Cruz Biotechnology) were added and incubated for 1 h. Anti-rabbit IgG-ATTO488 (Sigma) and anti-mouse–Alexa 647 (Invitrogen) were added and incubated for 1 h. Washed samples were post-fixed with 3% PFA + 0.1% glutaraldehyde. They were embedded following TDE protocol (27). SR-SIM imaging was performed using LSM880-ELYRA PS.1 system (Zeiss). Wide-field images (upper panel) and SR-SIM images (lower panel) of DLD-1 GD3S (left panel) and DLD-1 GD3S DES2/FA2H DKO (right panel) cells are shown. DAPI, 4,6-diamidino-2-phenylindole.

