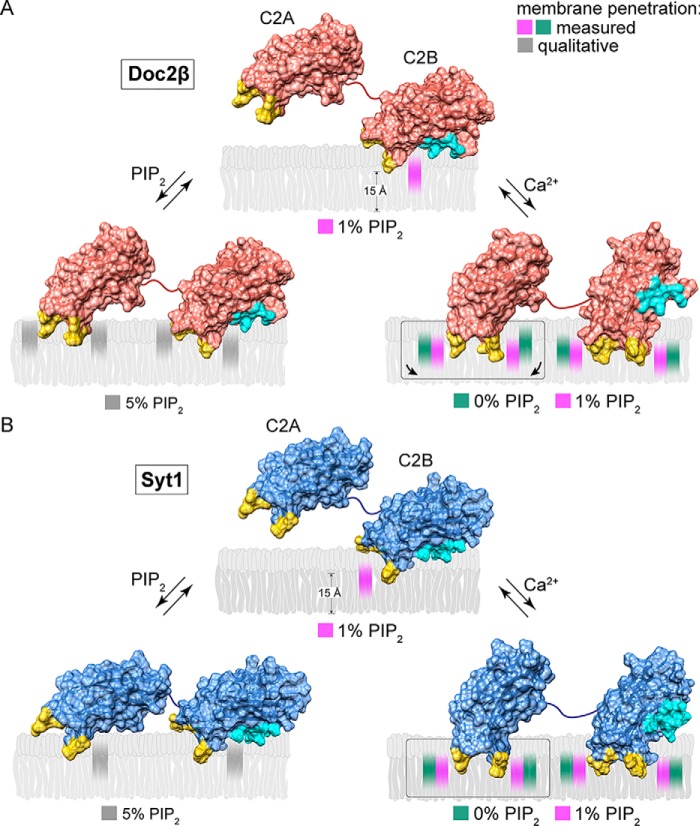
Figure 7.
Model of Ca2+-dependent and -independent membrane penetration by Doc2β and syt1 in the presence and absence of PIP2. Calculated membrane penetration depths are illustrated, to scale, for Doc2β and syt1. Models of syt1 and Doc2 were created by rendering the molecular surfaces of the corresponding X-ray or NMR structures (Doc2, as above; syt1, PDB codes 1RSY (C2A) and 1K5W (C2B) from Sutton et al. (53) and Fernandez et al. (54), respectively). The polybasic patch of C2B is rendered cyan in each model. Shaded areas in the bilayer represent the calculated half-widths of the penetration depth measurements for each probe. A, scale drawing of membrane penetration by Doc2β. Prior to binding Ca2+, C2B shallowly penetrates bilayers in the presence of 1% PIP2. After binding Ca2+, all four loops penetrate the bilayer. However, both loops in C2A are relegated to a shallow position unless PIP2 is also present, which enables C2A loop 3 to penetrate 3.7 Å deeper on average into the membrane. In the absence of Ca2+, increases in mol % PIP2 in the target membrane can drive partial penetration of the bilayer by all four loops of Doc2β. B, scale drawing of membrane penetration by syt1. As with Doc2β, 1% PIP2 enables Ca2+-independent penetration by C2B loop 3, and increasing [PIP2] drives penetration by C2A loop 3. Upon binding Ca2+, however, all four loops of syt1 penetrate deeply into the membrane even in the absence of PIP2.

