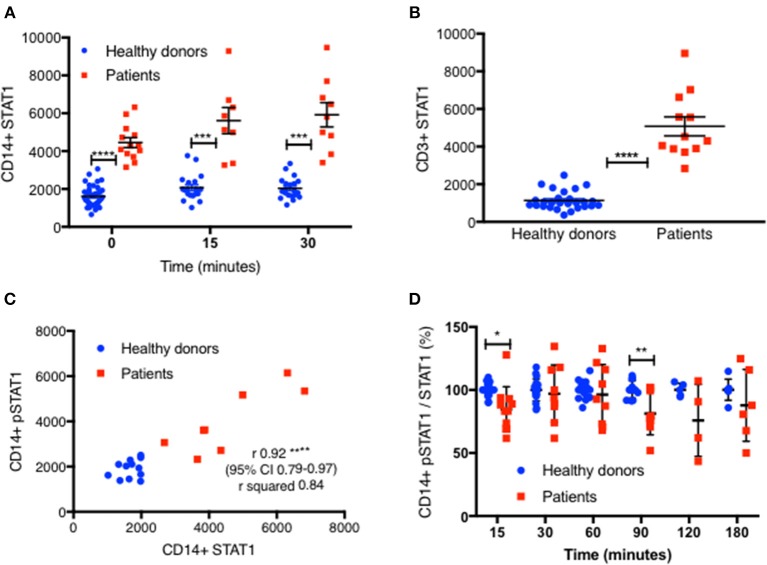
Figure 3.
STAT1 protein levels are increased in GOF CD14+ monocytes and CD3+ lymphocytes. (A) GOF patients' (red squares, n = 13) and healthy controls' (blue dots, n = 38) CD14+ monocytes STAT1 protein level, at rest, 15′ and 30′ after IFNγ stimulation, as measured by flow cytometry with anti-STAT1 AF647 antibody. Each red dot represents the average of repeated measurement of one patient (1–3). Each blue dot represents one measurement of a healthy control. Comparisons between the two groups were performed for each time point independently. Levels are expressed in geometric mean of fluorescence. (B) CD3+ cells STAT1 protein level in 12 tested GOF (red) patients compared with healthy controls (blue, n = 27), as measured by flow cytometry. Each red dot represents the average of repeated measurement of one patient (1–4). Each blue dot represents one measurement of a healthy control. (C) Pearson correlation of STAT1 protein level (x axis) vs. peak pSTAT1 level (y axis) in CD14+ monocytes of both patients (red squares, n = 8) and healthy controls (blue circles, n = 12) as measured by flow cytometry. Levels are presented in geometric mean of fluorescence. (D) CD14+ monocytes pSTAT1 level corrected by STAT1 protein level in healthy controls (blue dots, n = 5–20 per time point) and GOF patients (red squares, n = 4–11 per time point) 15–180′ after IFNγ stimulation. Data is presented in percentages of healthy controls average level. *P < 0.05; **P < 0.01; ***P < 0.001; ****P < 0.0001, by t test (A,B,D), and Pearson correlation (C). Quantitative data represent mean ± SEM.

