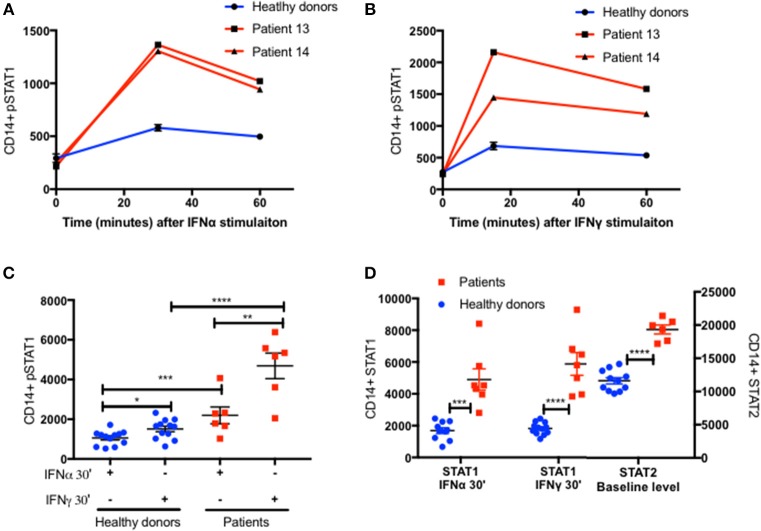
Figure 6.
Increased STAT2 protein level in patients CD14+ monocytes. Patients 13 and 14 (Red lines) CD14+ monocytes pSTAT1 level over 60 min following IFNα (A) and IFNγ (B) stimulation compared to two healthy donors' average level (blue line), as measured by flow cytometry with an anti pSTAT1 PerCP-Cy 5.5 antibody. Levels are expressed in geometric mean of fluorescence. (C) Patients (n = 6, red squares) and healthy donors (n = 11–12, blue dots) pSTAT1 level 30 min after IFNα or IFNγ stimulation as measured by flow cytometry. (D) Patients (n = 6, red squares) and healthy donors (n = 10–12, blue dots) STAT1 protein level 30 min after IFNα or IFNγ stimulation and baseline STAT2 protein level, as measured by flow cytometry. *P < 0.05; **P < 0.01; ***P < 0.001; ****P < 0.0001, by t test (C,D). Quantitative data represent mean ± SEM (A–D).

