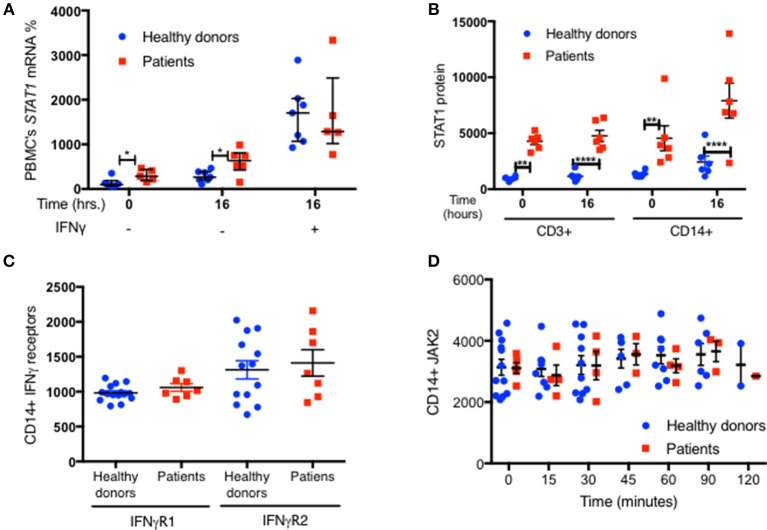
Figure 9.
Increased STAT1 mRNA expression in GOF PBMC. (A) Average fresh PBMC STAT1 mRNA relative expression at baseline and after 16 h in vitro incubation with and without IFNγ stimulation, in healthy controls (blue dots, n = 7) and GOF patients (red squares, n = 6). Levels are expressed in percentages of same day healthy controls median STAT1 mRNA relative expression. Each dot or square represent an average of 1–3 biological replicates. Beta actin was used as the normalizing gene. (B) CD3+ and CD14+ cells STAT1 protein level in the samples used for the RNA extraction of the seven healthy controls and six GOF patients in (A). STAT1 levels were measured by flow cytometry and are expressed in geometric mean of fluorescence. (C) Levels of IFNγ receptors (R) 1 and 2 in healthy controls (blue dots; n = 13–15) and GOF patients (red squares, n = 7), as measured by flow cytometry. Data is represented in geometric mean of fluorescence. Each dot or square represents the average of two technical duplicates. (D) JAK2 protein level in healthy controls (blue dots, n = 2–12 per time point) and GOF patients (red square, n = 1–5 per time point) at rest (time o) and up to 2 h of IFNγ stimulation, as measured by flow cytometry. Data is represented in geometric mean of fluorescence. *P < 0.05; **P < 0.01; ****P < 0.0001, by t-test, Quantitative data represent mean ± SEM.

