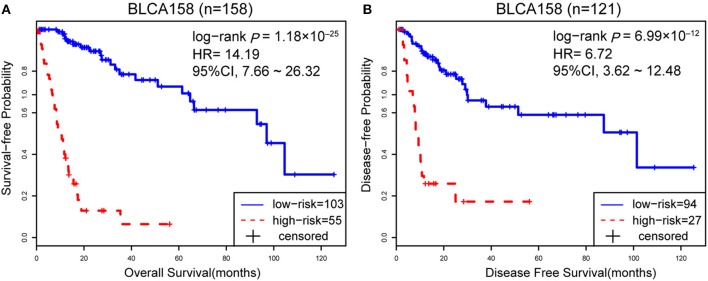
Figure 1.
The Kaplan-Meier curves of DFS and OS for prognostic groups predicted by 12-GPS in the training dataset. A patient was classified into the high-risk group when more than half of the gene pairs in the 12-GPS vote for high risk, and vice versa. Kaplan-Meier curves of OS for the training dataset BLCA158 (A); Kaplan-Meier curves of DFS for the training dataset BLCA158 (B).

